
SPECpower_ssj2008
Host 'WIN-F9VKUN2L28K' Performance Report
Copyright © 2007-2025 Standard Performance Evaluation Corporation
| Lenovo Global Technology ThinkSystem ST45 V3 | ssj_ops@100% = 2,806,077 ssj_ops@100% per JVM = 467,679 |
||||
| Test Sponsor: | Lenovo Global Technology | SPEC License #: | 9017 | Test Method: | Single Node |
| Tested By: | Lenovo Global Technology | Test Location: | Beijing, China | Test Date: | Nov 19, 2025 |
| Hardware Availability: | Nov-2025 | Software Availability: | Jan-2024 | Publication: | Dec 18, 2025 |
| System Source: | Single Supplier | System Designation: | Server | Power Provisioning: | Line-powered |
| Target Load | Actual Load | ssj_ops | |
|---|---|---|---|
| Target | Actual | ||
| Calibration 1 | 2,765,139 | ||
| Calibration 2 | 2,812,514 | ||
| Calibration 3 | 2,817,463 | ||
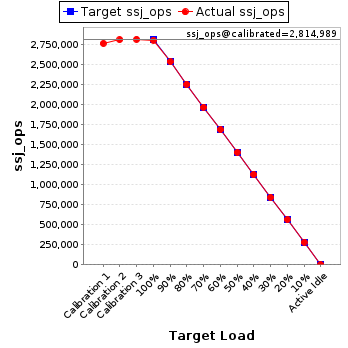
| ssj_ops@calibrated=2,814,989 | |||
| 100% | 99.7% | 2,814,989 | 2,806,077 |
| 90% | 90.1% | 2,533,490 | 2,536,376 |
| 80% | 80.1% | 2,251,991 | 2,254,713 |
| 70% | 69.9% | 1,970,492 | 1,968,306 |
| 60% | 60.0% | 1,688,993 | 1,687,761 |
| 50% | 49.9% | 1,407,494 | 1,403,841 |
| 40% | 40.0% | 1,125,995 | 1,127,153 |
| 30% | 29.9% | 844,497 | 842,512 |
| 20% | 20.0% | 562,998 | 563,312 |
| 10% | 10.0% | 281,499 | 281,097 |
| Active Idle | 0 | 0 | |
| Set Identifier: | sut |
| Set Description: | System Under Test |
| # of Identical Nodes: | 1 |
| Comment: | 'SUT' |
| Hardware | |
|---|---|
| Hardware Vendor: | Lenovo Global Technology |
| Model: | ThinkSystem ST45 V3 |
| Form Factor: | Tower |
| CPU Name: | AMD EPYC 4465P |
| CPU Characteristics: | 12 core, 3.4GHz, 64MB L3 Cache |
| CPU Frequency (MHz): | 3400 |
| CPU(s) Enabled: | 12 cores, 1 chip, 12 cores/chip |
| Hardware Threads: | 24 (2 / core) |
| CPU(s) Orderable: | 1 chip |
| Primary Cache: | 32 KB I + 64 KB D on chip per core |
| Secondary Cache: | 512 KB I+D on chip per core |
| Tertiary Cache: | 64 MB I+D off chip per chip |
| Other Cache: | None |
| Memory Amount (GB): | 32.0 |
| # and size of DIMM: | 2 x 16 GB |
| Memory Details: | 2 x 16GB 1Rx8 PC5-5600;slots 1 and 2 populated |
| Power Supply Quantity and Rating (W): | 1 x 300 |
| Power Supply Details: | Lenovo |
| Disk Drive: | 1 x 480GB M.2 NVMe SSD P/N:4XB7A83139 |
| Disk Controller: | Integrated NVME controller |
| # and type of Network Interface Cards (NICs) Installed: | 1 x ThinkSystem 1GbE RJ45 1-port |
| NICs Enabled in Firmware / OS / Connected: | 1/1/1 |
| Network Speed (Mbit): | 1000 |
| Keyboard: | None |
| Mouse: | None |
| Monitor: | None |
| Optical Drives: | No |
| Other Hardware: | None |
| Software | |
|---|---|
| Power Management: | Enabled (see SUT Notes) |
| Operating System (OS): | Microsoft Windows Server 2022 Datacenter |
| OS Version: | Version 21H2(OS Build 20348.2227) |
| Filesystem: | NTFS |
| JVM Vendor: | Oracle Corporation |
| JVM Version: | Oracle Java HotSpot(TM) 64-Bit Server VM (build 17.0.10+11-LTS-240, mixed mode, sharing), version 17.0.10 |
| JVM Command-line Options: | -server -Xmn1900m -Xms2048m -Xmx2048m -XX:ParallelGCThreads=2 -XX:+UseLargePages -XX:LargePageSizeInBytes=2m -XX:InlineSmallCode=1500 -XX:UseAVX=1 -XX:AutoBoxCacheMax=20000 -XX:+UseParallelGC -XX:+OptimizeFill -XX:+AggressiveHeap -XX:MaxInlineSize=270 -XX:FreqInlineSize=2500 |
| JVM Affinity: | start /NODE[0] /AFFINITY [0xF, 0xF0, 0xF00, 0xF000, 0xF000, 0xF0000] |
| JVM Instances: | 6 |
| JVM Initial Heap (MB): | 2048 |
| JVM Maximum Heap (MB): | 2048 |
| JVM Address Bits: | 64 |
| Boot Firmware Version: | QIE105F |
| Management Firmware Version: | None |
| Workload Version: | SSJ 1.2.10 |
| Director Location: | Controller |
| Other Software: | None |
| JVM Instance | ssj_ops@100% |
|---|---|
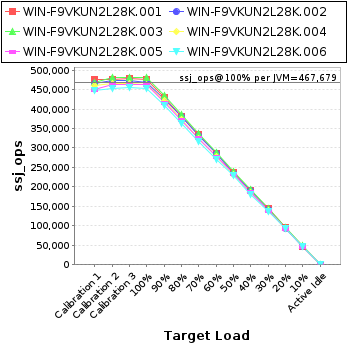
| WIN-F9VKUN2L28K.001 | 477,124 |
| WIN-F9VKUN2L28K.002 | 469,240 |
| WIN-F9VKUN2L28K.003 | 480,802 |
| WIN-F9VKUN2L28K.004 | 463,132 |
| WIN-F9VKUN2L28K.005 | 462,884 |
| WIN-F9VKUN2L28K.006 | 452,895 |
| ssj_ops@100% | 2,806,077 |
| ssj_ops@100% per JVM | 467,679 |
| Target Load | Actual Load | ssj_ops | |
|---|---|---|---|
| Target | Actual | ||
| Calibration 1 | 474,996 | ||
| Calibration 2 | 476,740 | ||
| Calibration 3 | 477,983 | ||
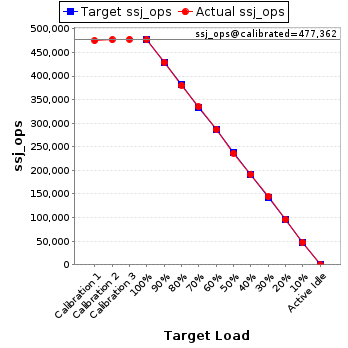
| ssj_ops@calibrated=477,362 | |||
| 100% | 100.0% | 477,362 | 477,124 |
| 90% | 89.9% | 429,626 | 429,080 |
| 80% | 79.6% | 381,889 | 380,117 |
| 70% | 70.1% | 334,153 | 334,783 |
| 60% | 60.1% | 286,417 | 286,838 |
| 50% | 49.5% | 238,681 | 236,390 |
| 40% | 40.1% | 190,945 | 191,206 |
| 30% | 30.2% | 143,209 | 144,131 |
| 20% | 20.1% | 95,472 | 95,750 |
| 10% | 10.0% | 47,736 | 47,541 |
| Active Idle | 0 | 0 | |
| Target Load | Actual Load | ssj_ops | |
|---|---|---|---|
| Target | Actual | ||
| Calibration 1 | 466,012 | ||
| Calibration 2 | 472,404 | ||
| Calibration 3 | 473,634 | ||
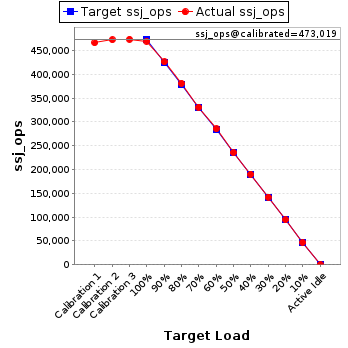
| ssj_ops@calibrated=473,019 | |||
| 100% | 99.2% | 473,019 | 469,240 |
| 90% | 90.0% | 425,717 | 425,954 |
| 80% | 80.6% | 378,415 | 381,188 |
| 70% | 69.9% | 331,113 | 330,874 |
| 60% | 60.3% | 283,811 | 285,374 |
| 50% | 49.8% | 236,510 | 235,544 |
| 40% | 40.2% | 189,208 | 190,072 |
| 30% | 30.0% | 141,906 | 142,036 |
| 20% | 19.9% | 94,604 | 94,146 |
| 10% | 9.9% | 47,302 | 46,941 |
| Active Idle | 0 | 0 | |
| Target Load | Actual Load | ssj_ops | |
|---|---|---|---|
| Target | Actual | ||
| Calibration 1 | 467,278 | ||
| Calibration 2 | 481,263 | ||
| Calibration 3 | 481,834 | ||
| ssj_ops@calibrated=481,548 | |||
| 100% | 99.8% | 481,548 | 480,802 |
| 90% | 90.2% | 433,393 | 434,219 |
| 80% | 80.0% | 385,239 | 385,238 |
| 70% | 69.9% | 337,084 | 336,756 |
| 60% | 60.1% | 288,929 | 289,460 |
| 50% | 49.6% | 240,774 | 238,790 |
| 40% | 40.0% | 192,619 | 192,573 |
| 30% | 30.0% | 144,464 | 144,420 |
| 20% | 20.1% | 96,310 | 96,714 |
| 10% | 10.1% | 48,155 | 48,524 |
| Active Idle | 0 | 0 | |

| Target Load | Actual Load | ssj_ops | |
|---|---|---|---|
| Target | Actual | ||
| Calibration 1 | 459,601 | ||
| Calibration 2 | 465,029 | ||
| Calibration 3 | 464,942 | ||
| ssj_ops@calibrated=464,986 | |||
| 100% | 99.6% | 464,986 | 463,132 |
| 90% | 90.6% | 418,487 | 421,189 |
| 80% | 80.4% | 371,988 | 373,890 |
| 70% | 69.9% | 325,490 | 325,257 |
| 60% | 59.8% | 278,991 | 278,114 |
| 50% | 49.8% | 232,493 | 231,509 |
| 40% | 40.0% | 185,994 | 185,908 |
| 30% | 29.7% | 139,496 | 138,033 |
| 20% | 20.0% | 92,997 | 92,915 |
| 10% | 10.0% | 46,499 | 46,295 |
| Active Idle | 0 | 0 | |

| Target Load | Actual Load | ssj_ops | |
|---|---|---|---|
| Target | Actual | ||
| Calibration 1 | 449,766 | ||
| Calibration 2 | 462,982 | ||
| Calibration 3 | 464,118 | ||
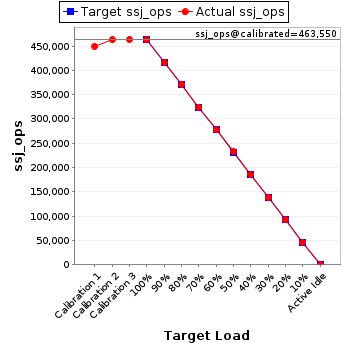
| ssj_ops@calibrated=463,550 | |||
| 100% | 99.9% | 463,550 | 462,884 |
| 90% | 89.8% | 417,195 | 416,190 |
| 80% | 80.2% | 370,840 | 371,782 |
| 70% | 70.0% | 324,485 | 324,449 |
| 60% | 59.8% | 278,130 | 277,356 |
| 50% | 50.3% | 231,775 | 233,310 |
| 40% | 40.1% | 185,420 | 185,742 |
| 30% | 29.9% | 139,065 | 138,468 |
| 20% | 19.8% | 92,710 | 92,014 |
| 10% | 10.0% | 46,355 | 46,250 |
| Active Idle | 0 | 0 | |
| Target Load | Actual Load | ssj_ops | |
|---|---|---|---|
| Target | Actual | ||
| Calibration 1 | 447,484 | ||
| Calibration 2 | 454,096 | ||
| Calibration 3 | 454,952 | ||
| ssj_ops@calibrated=454,524 | |||
| 100% | 99.6% | 454,524 | 452,895 |
| 90% | 90.1% | 409,072 | 409,744 |
| 80% | 79.8% | 363,619 | 362,497 |
| 70% | 69.6% | 318,167 | 316,187 |
| 60% | 59.5% | 272,714 | 270,619 |
| 50% | 50.2% | 227,262 | 228,297 |
| 40% | 40.0% | 181,810 | 181,651 |
| 30% | 29.8% | 136,357 | 135,424 |
| 20% | 20.2% | 90,905 | 91,773 |
| 10% | 10.0% | 45,452 | 45,547 |
| Active Idle | 0 | 0 | |
