SPECpower_ssj2008
Aggregate Performance Report
Copyright © 2007-2019 Standard Performance Evaluation Corporation
| Lenovo Global Technology ThinkSystem SN850 | ssj_ops@100% = 71,032,994 ssj_ops@100% per Host = 10,147,571 ssj_ops@100% per JVM = 90,603 |
||||
| Test Sponsor: | Lenovo Global Technology | SPEC License #: | 9017 | Test Method: | Multi Node |
| Tested By: | Lenovo Global Technology | Test Location: | Beijing, China | Test Date: | Jul 19, 2019 |
| Hardware Availability: | Apr-2019 | Software Availability: | Dec-2018 | Publication: | Aug 21, 2019 |
| System Source: | Single Supplier | System Designation: | Server | Power Provisioning: | Line-powered |
| Target Load | Actual Load | ssj_ops | |
|---|---|---|---|
| Target | Actual | ||
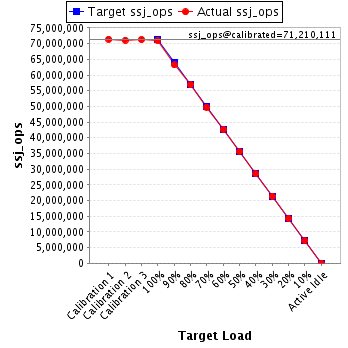
| Calibration 1 | 71,433,756 | ||
| Calibration 2 | 71,112,427 | ||
| Calibration 3 | 71,307,796 | ||
| ssj_ops@calibrated=71,210,111 | |||
| 100% | 99.8% | 71,210,111 | 71,032,994 |
| 90% | 88.8% | 64,089,100 | 63,213,687 |
| 80% | 79.8% | 56,968,089 | 56,851,300 |
| 70% | 69.9% | 49,847,078 | 49,807,706 |
| 60% | 60.0% | 42,726,067 | 42,731,377 |
| 50% | 50.0% | 35,605,056 | 35,592,961 |
| 40% | 40.0% | 28,484,045 | 28,481,310 |
| 30% | 30.0% | 21,363,033 | 21,373,326 |
| 20% | 20.0% | 14,242,022 | 14,245,098 |
| 10% | 10.0% | 7,121,011 | 7,121,323 |
| Active Idle | 0 | 0 | |
| # of Nodes | # of Chips | # of Cores | # of Threads | Total RAM (GB) | # of OS Images | # of JVM Instances |
|---|---|---|---|---|---|---|
| 7 | 28 | 784 | 1,568 | 2,688 | 7 | 784 |
| Set Identifier: | sut |
| Set Description: | System Under Test |
| # of Identical Nodes: | 7 |
| Comment: | 'SUT' |
| Hardware per Node | |
|---|---|
| Hardware Vendor: | Lenovo Global Technology |
| Model: | ThinkSystem SN850 |
| Form Factor: | 10U |
| CPU Name: | Intel Xeon Platinum 8276L |
| CPU Characteristics: | 28-Core, 2.20 GHz, 39424 KB L3 Cache |
| CPU Frequency (MHz): | 2200 |
| CPU(s) Enabled: | 112 cores, 4 chips, 28 cores/chip |
| Hardware Threads: | 224 (2 / core) |
| CPU(s) Orderable: | 2,4 chips |
| Primary Cache: | 32 KB I + 32 KB D on chip per core |
| Secondary Cache: | 1 MB I+D on chip per core |
| Tertiary Cache: | 39424 KB I+D on chip per chip |
| Other Cache: | None |
| Memory Amount (GB): | 384 |
| # and size of DIMM: | 24 x 16 GB |
| Memory Details: | 16GB 2Rx8 PC4-2933V-RE1-12-MA0; slots 1,3,5,8,10,12,13,15,17,20,22,24,25,27,29,32,34,36,37,39,41,44,46 and 48 for each processor |
| Power Supply Quantity and Rating (W): | None |
| Power Supply Details: | Shared |
| Disk Drive: | 1 x 128GB M.2 SSD (Lenovo P/N 7N47A00130) |
| Disk Controller: | Integrated SATA controller |
| # and type of Network Interface Cards (NICs) Installed: | 1 x Intel Ethernet Connection X722 for 10GBASE-T |
| NICs Enabled in Firmware / OS / Connected: | 1/1/1 |
| Network Speed (Mbit): | 1000 |
| Keyboard: | None |
| Mouse: | None |
| Monitor: | None |
| Optical Drives: | No |
| Other Hardware: | None |
| Software per Node | |
|---|---|
| Power Management: | Enabled (see SUT Notes) |
| Operating System (OS): | SUSE Linux Enterprise Server 12 SP4 |
| OS Version: | Kernel 4.12.14-94.41-default |
| Filesystem: | btrfs |
| JVM Vendor: | Oracle Corporation |
| JVM Version: | Oracle Java HotSpot(TM) 64-Bit Server VM (build 24.80-b11, mixed mode), version 1.7.0_80 |
| JVM Command-line Options: | -server -Xmn1300m -Xms1550m -Xmx1550m -XX:SurvivorRatio=1 -XX:TargetSurvivorRatio=99 -XX:AllocatePrefetchDistance=256 -XX:AllocatePrefetchLines=4 -XX:LoopUnrollLimit=45 -XX:InitialTenuringThreshold=12 -XX:MaxTenuringThreshold=15 -XX:ParallelGCThreads=2 -XX:InlineSmallCode=3900 -XX:MaxInlineSize=270 -XX:FreqInlineSize=2500 -XX:+AggressiveOpts -XX:+UseLargePages -XX:+UseParallelOldGC -XX:LargePageSizeInBytes=2m |
| JVM Affinity: | for each physicalCore { numactl -C physicalCoreId, physicalCoreId + 112 } |
| JVM Instances: | 112 |
| JVM Initial Heap (MB): | 1550 |
| JVM Maximum Heap (MB): | 1550 |
| JVM Address Bits: | 64 |
| Boot Firmware Version: | IVE141C |
| Management Firmware Version: | TEI351C |
| Workload Version: | SSJ 1.2.10 |
| Director Location: | Controller |
| Other Software: | None |
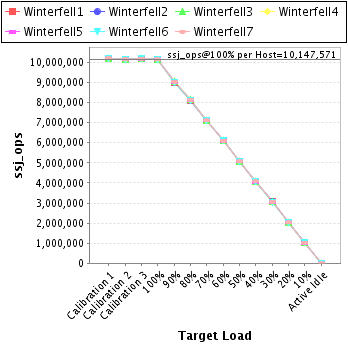
| Host | ssj_ops@100% |
|---|---|
| Winterfell1 | 10,139,351 |
| Winterfell2 | 10,152,863 |
| Winterfell3 | 10,154,623 |
| Winterfell4 | 10,142,351 |
| Winterfell5 | 10,150,465 |
| Winterfell6 | 10,137,511 |
| Winterfell7 | 10,155,829 |
| ssj_ops@100% | 71,032,994 |
| ssj_ops@100% per Host | 10,147,571 |
| ssj_ops@100% per JVM | 90,603 |
| Target Load | Actual Load | ssj_ops | |
|---|---|---|---|
| Target | Actual | ||
| Calibration 1 | 10,190,882 | ||
| Calibration 2 | 10,152,678 | ||
| Calibration 3 | 10,179,360 | ||
| ssj_ops@calibrated=10,166,019 | |||
| 100% | 99.7% | 10,166,019 | 10,139,351 |
| 90% | 88.8% | 9,149,417 | 9,025,757 |
| 80% | 79.8% | 8,132,815 | 8,117,421 |
| 70% | 69.9% | 7,116,213 | 7,110,035 |
| 60% | 60.0% | 6,099,611 | 6,099,603 |
| 50% | 50.0% | 5,083,009 | 5,081,871 |
| 40% | 40.0% | 4,066,408 | 4,065,806 |
| 30% | 30.0% | 3,049,806 | 3,052,558 |
| 20% | 20.0% | 2,033,204 | 2,034,638 |
| 10% | 10.0% | 1,016,602 | 1,015,279 |
| Active Idle | 0 | 0 | |
| Target Load | Actual Load | ssj_ops | |
|---|---|---|---|
| Target | Actual | ||
| Calibration 1 | 10,201,749 | ||
| Calibration 2 | 10,160,739 | ||
| Calibration 3 | 10,199,840 | ||
| ssj_ops@calibrated=10,180,290 | |||
| 100% | 99.7% | 10,180,290 | 10,152,863 |
| 90% | 88.7% | 9,162,261 | 9,026,692 |
| 80% | 79.8% | 8,144,232 | 8,127,094 |
| 70% | 70.0% | 7,126,203 | 7,125,879 |
| 60% | 60.1% | 6,108,174 | 6,116,634 |
| 50% | 50.0% | 5,090,145 | 5,085,602 |
| 40% | 40.0% | 4,072,116 | 4,068,151 |
| 30% | 30.0% | 3,054,087 | 3,054,370 |
| 20% | 20.0% | 2,036,058 | 2,033,926 |
| 10% | 10.0% | 1,018,029 | 1,017,155 |
| Active Idle | 0 | 0 | |

| Target Load | Actual Load | ssj_ops | |
|---|---|---|---|
| Target | Actual | ||
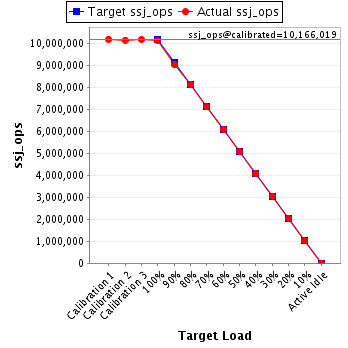
| Calibration 1 | 10,214,674 | ||
| Calibration 2 | 10,166,979 | ||
| Calibration 3 | 10,196,851 | ||
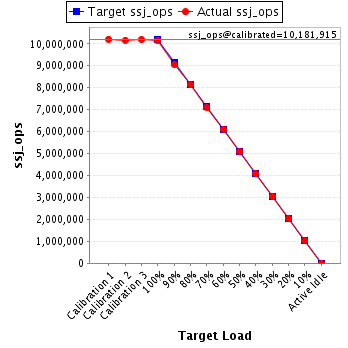
| ssj_ops@calibrated=10,181,915 | |||
| 100% | 99.7% | 10,181,915 | 10,154,623 |
| 90% | 88.9% | 9,163,723 | 9,048,196 |
| 80% | 79.9% | 8,145,532 | 8,133,785 |
| 70% | 69.9% | 7,127,340 | 7,120,805 |
| 60% | 60.0% | 6,109,149 | 6,105,801 |
| 50% | 50.0% | 5,090,957 | 5,091,298 |
| 40% | 40.0% | 4,072,766 | 4,072,093 |
| 30% | 30.0% | 3,054,574 | 3,055,472 |
| 20% | 20.0% | 2,036,383 | 2,035,923 |
| 10% | 10.0% | 1,018,191 | 1,020,628 |
| Active Idle | 0 | 0 | |
| Target Load | Actual Load | ssj_ops | |
|---|---|---|---|
| Target | Actual | ||
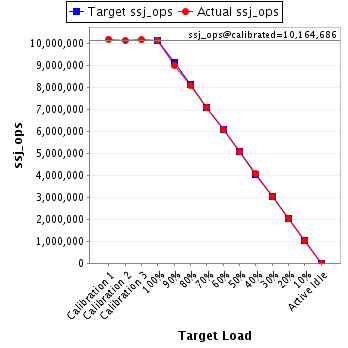
| Calibration 1 | 10,209,193 | ||
| Calibration 2 | 10,152,061 | ||
| Calibration 3 | 10,177,311 | ||
| ssj_ops@calibrated=10,164,686 | |||
| 100% | 99.8% | 10,164,686 | 10,142,351 |
| 90% | 88.7% | 9,148,217 | 9,015,341 |
| 80% | 79.9% | 8,131,749 | 8,118,706 |
| 70% | 70.0% | 7,115,280 | 7,113,103 |
| 60% | 60.0% | 6,098,812 | 6,100,536 |
| 50% | 50.1% | 5,082,343 | 5,088,003 |
| 40% | 40.0% | 4,065,874 | 4,070,424 |
| 30% | 30.0% | 3,049,406 | 3,048,863 |
| 20% | 20.0% | 2,032,937 | 2,030,978 |
| 10% | 10.0% | 1,016,469 | 1,018,501 |
| Active Idle | 0 | 0 | |
| Target Load | Actual Load | ssj_ops | |
|---|---|---|---|
| Target | Actual | ||
| Calibration 1 | 10,206,013 | ||
| Calibration 2 | 10,155,723 | ||
| Calibration 3 | 10,188,594 | ||
| ssj_ops@calibrated=10,172,159 | |||
| 100% | 99.8% | 10,172,159 | 10,150,465 |
| 90% | 88.8% | 9,154,943 | 9,032,195 |
| 80% | 79.8% | 8,137,727 | 8,117,202 |
| 70% | 69.9% | 7,120,511 | 7,115,067 |
| 60% | 60.0% | 6,103,295 | 6,101,535 |
| 50% | 49.9% | 5,086,079 | 5,079,911 |
| 40% | 40.0% | 4,068,863 | 4,070,496 |
| 30% | 30.0% | 3,051,648 | 3,053,260 |
| 20% | 20.0% | 2,034,432 | 2,037,462 |
| 10% | 10.0% | 1,017,216 | 1,019,663 |
| Active Idle | 0 | 0 | |

| Target Load | Actual Load | ssj_ops | |
|---|---|---|---|
| Target | Actual | ||
| Calibration 1 | 10,198,310 | ||
| Calibration 2 | 10,150,826 | ||
| Calibration 3 | 10,174,137 | ||
| ssj_ops@calibrated=10,162,481 | |||
| 100% | 99.8% | 10,162,481 | 10,137,511 |
| 90% | 88.8% | 9,146,233 | 9,026,641 |
| 80% | 79.8% | 8,129,985 | 8,105,058 |
| 70% | 69.9% | 7,113,737 | 7,103,451 |
| 60% | 60.0% | 6,097,489 | 6,101,439 |
| 50% | 50.0% | 5,081,241 | 5,085,053 |
| 40% | 39.9% | 4,064,993 | 4,058,969 |
| 30% | 30.0% | 3,048,744 | 3,049,786 |
| 20% | 20.1% | 2,032,496 | 2,038,106 |
| 10% | 10.0% | 1,016,248 | 1,013,962 |
| Active Idle | 0 | 0 | |

| Target Load | Actual Load | ssj_ops | |
|---|---|---|---|
| Target | Actual | ||
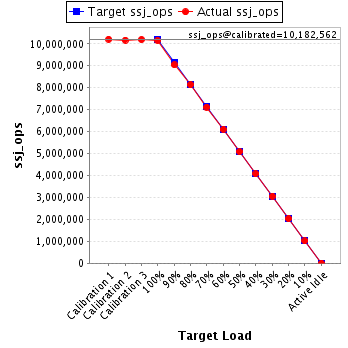
| Calibration 1 | 10,212,935 | ||
| Calibration 2 | 10,173,422 | ||
| Calibration 3 | 10,191,702 | ||
| ssj_ops@calibrated=10,182,562 | |||
| 100% | 99.7% | 10,182,562 | 10,155,829 |
| 90% | 88.8% | 9,164,306 | 9,038,864 |
| 80% | 79.9% | 8,146,050 | 8,132,033 |
| 70% | 69.9% | 7,127,794 | 7,119,365 |
| 60% | 60.0% | 6,109,537 | 6,105,829 |
| 50% | 49.9% | 5,091,281 | 5,081,222 |
| 40% | 40.0% | 4,073,025 | 4,075,371 |
| 30% | 30.0% | 3,054,769 | 3,059,017 |
| 20% | 20.0% | 2,036,512 | 2,034,064 |
| 10% | 10.0% | 1,018,256 | 1,016,136 |
| Active Idle | 0 | 0 | |