SPECpower_ssj2008
Host 'WIN-SUT109' Performance Report
Copyright © 2007-2019 Standard Performance Evaluation Corporation
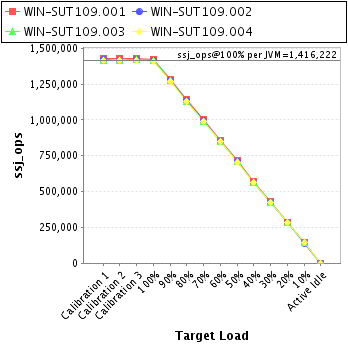
| New H3C Technologies Co., Ltd. H3C UniServer B5700 G3 | ssj_ops@100% = 5,664,889 ssj_ops@100% per JVM = 1,416,222 |
||||
| Test Sponsor: | New H3C Technologies Co., Ltd. | SPEC License #: | 9066 | Test Method: | Multi Node |
| Tested By: | New H3C Technologies Co., Ltd. | Test Location: | Hangzhou, Zhejiang, China | Test Date: | May 6, 2019 |
| Hardware Availability: | Jan-2019 | Software Availability: | Jan-2019 | Publication: | Jun 5, 2019 |
| System Source: | Single Supplier | System Designation: | Server | Power Provisioning: | Line-powered |
| Target Load | Actual Load | ssj_ops | |
|---|---|---|---|
| Target | Actual | ||
| Calibration 1 | 5,678,219 | ||
| Calibration 2 | 5,676,807 | ||
| Calibration 3 | 5,687,222 | ||
| ssj_ops@calibrated=5,682,014 | |||
| 100% | 99.7% | 5,682,014 | 5,664,889 |
| 90% | 89.9% | 5,113,813 | 5,110,316 |
| 80% | 79.8% | 4,545,611 | 4,536,564 |
| 70% | 70.0% | 3,977,410 | 3,976,988 |
| 60% | 60.0% | 3,409,209 | 3,411,700 |
| 50% | 50.0% | 2,841,007 | 2,841,198 |
| 40% | 39.9% | 2,272,806 | 2,268,188 |
| 30% | 30.0% | 1,704,604 | 1,703,357 |
| 20% | 20.0% | 1,136,403 | 1,136,404 |
| 10% | 10.0% | 568,201 | 569,284 |
| Active Idle | 0 | 0 | |

| Set Identifier: | sut |
| Set Description: | System Under Test |
| # of Identical Nodes: | 9 |
| Comment: | SUT |
| Hardware | |
|---|---|
| Hardware Vendor: | New H3C Technologies Co., Ltd. |
| Model: | H3C UniServer B5700 G3 |
| Form Factor: | Other |
| CPU Name: | Intel Xeon Platinum 8180 2.50GHz |
| CPU Characteristics: | 28-Core, 2.50 GHz, 38.5 MB L3 Cache |
| CPU Frequency (MHz): | 2500 |
| CPU(s) Enabled: | 56 cores, 2 chips, 28 cores/chip |
| Hardware Threads: | 112 (2 / core) |
| CPU(s) Orderable: | 1,2 chips |
| Primary Cache: | 32 KB I + 32 KB D on chip per core |
| Secondary Cache: | 1 MB I+D on chip per core |
| Tertiary Cache: | 39424 KB I+D on chip per chip |
| Other Cache: | None |
| Memory Amount (GB): | 192.0 |
| # and size of DIMM: | 12 x 16384 MB |
| Memory Details: | 12 x 16GB 2Rx8 PC4-2666-V ECC;slots A1, A2, A3, A4, A5, A6, B1, B2, B3, B4, B5, B6 populated |
| Power Supply Quantity and Rating (W): | None |
| Power Supply Details: | Shared |
| Disk Drive: | SATA DOM 128GB P/N DESSH-A28D09BCADCA |
| Disk Controller: | Integrated SATA controller |
| # and type of Network Interface Cards (NICs) Installed: | 1 x Intel I350 Gigabit Ethernet Controller |
| NICs Enabled in Firmware / OS / Connected: | 2/2/1 |
| Network Speed (Mbit): | 1000 |
| Keyboard: | None |
| Mouse: | None |
| Monitor: | None |
| Optical Drives: | No |
| Other Hardware: | None |
| Software | |
|---|---|
| Power Management: | Balanced Mode enabled in OS (see SUT Notes) |
| Operating System (OS): | Microsoft Windows Server 2012 R2 Datacenter |
| OS Version: | Version 6.3 (Build 9600) |
| Filesystem: | NTFS |
| JVM Vendor: | Oracle Corporation |
| JVM Version: | Java HotSpot(TM) 64-Bit Server VM (build 24.80-b11, mixed mode), version 1.7.0_80 |
| JVM Command-line Options: | -server -Xmn19g -Xms21g -Xmx21g -XX:SurvivorRatio=1 -XX:TargetSurvivorRatio=99 -XX:ParallelGCThreads=28 -XX:AllocatePrefetchDistance=256 -XX:AllocatePrefetchLines=4 -XX:LoopUnrollLimit=45 -XX:InitialTenuringThreshold=12 -XX:MaxTenuringThreshold=15 -XX:InlineSmallCode=9000 -XX:MaxInlineSize=270 -XX:FreqInlineSize=6000 -XX:+UseLargePages -XX:+UseParallelOldGC -XX:+AggressiveOpts |
| JVM Affinity: | start /NODE [0,2] /AFFINITY [0xFC0FF00FC0FF];start /NODE [1,3] /AFFINITY [0xFF03F00FF03F] |
| JVM Instances: | 4 |
| JVM Initial Heap (MB): | 21000 |
| JVM Maximum Heap (MB): | 21000 |
| JVM Address Bits: | 64 |
| Boot Firmware Version: | 2.00.25 |
| Management Firmware Version: | UIS-OM 1.00.10 |
| Workload Version: | SSJ 1.2.10 |
| Director Location: | Controller |
| Other Software: | Microsoft Windows KB3021910, clearcompressionflag.exe, KB2919355, KB2932046, KB2959977, KB2937592, KB2938439, KB2934018, KB4056898, patched to this test system in May 05, 2019 |
| JVM Instance | ssj_ops@100% |
|---|---|
| WIN-SUT109.001 | 1,423,109 |
| WIN-SUT109.002 | 1,418,104 |
| WIN-SUT109.003 | 1,413,200 |
| WIN-SUT109.004 | 1,410,476 |
| ssj_ops@100% | 5,664,889 |
| ssj_ops@100% per JVM | 1,416,222 |
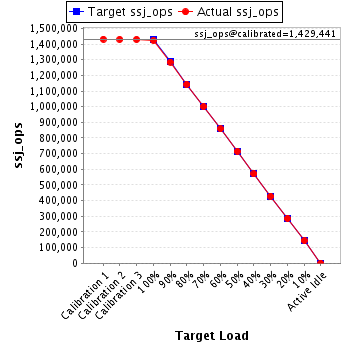
| Target Load | Actual Load | ssj_ops | |
|---|---|---|---|
| Target | Actual | ||
| Calibration 1 | 1,431,024 | ||
| Calibration 2 | 1,429,566 | ||
| Calibration 3 | 1,429,317 | ||
| ssj_ops@calibrated=1,429,441 | |||
| 100% | 99.6% | 1,429,441 | 1,423,109 |
| 90% | 89.9% | 1,286,497 | 1,285,133 |
| 80% | 79.9% | 1,143,553 | 1,142,661 |
| 70% | 70.0% | 1,000,609 | 1,000,992 |
| 60% | 60.0% | 857,665 | 857,856 |
| 50% | 50.1% | 714,721 | 715,532 |
| 40% | 39.9% | 571,777 | 570,350 |
| 30% | 30.0% | 428,832 | 428,690 |
| 20% | 20.0% | 285,888 | 286,227 |
| 10% | 10.1% | 142,944 | 144,416 |
| Active Idle | 0 | 0 | |
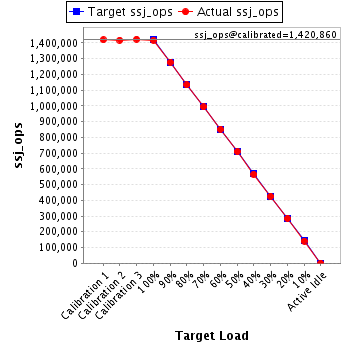
| Target Load | Actual Load | ssj_ops | |
|---|---|---|---|
| Target | Actual | ||
| Calibration 1 | 1,419,165 | ||
| Calibration 2 | 1,417,739 | ||
| Calibration 3 | 1,423,980 | ||
| ssj_ops@calibrated=1,420,860 | |||
| 100% | 99.8% | 1,420,860 | 1,418,104 |
| 90% | 89.9% | 1,278,774 | 1,277,815 |
| 80% | 79.8% | 1,136,688 | 1,133,239 |
| 70% | 69.9% | 994,602 | 993,243 |
| 60% | 60.0% | 852,516 | 852,625 |
| 50% | 49.9% | 710,430 | 709,712 |
| 40% | 39.8% | 568,344 | 565,723 |
| 30% | 30.0% | 426,258 | 426,120 |
| 20% | 20.0% | 284,172 | 284,605 |
| 10% | 9.9% | 142,086 | 141,256 |
| Active Idle | 0 | 0 | |
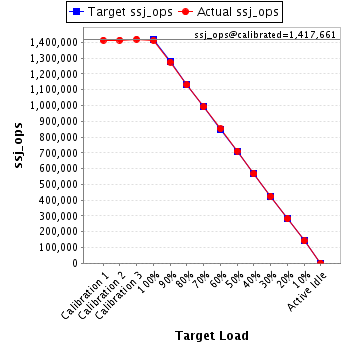
| Target Load | Actual Load | ssj_ops | |
|---|---|---|---|
| Target | Actual | ||
| Calibration 1 | 1,414,433 | ||
| Calibration 2 | 1,414,839 | ||
| Calibration 3 | 1,420,483 | ||
| ssj_ops@calibrated=1,417,661 | |||
| 100% | 99.7% | 1,417,661 | 1,413,200 |
| 90% | 90.0% | 1,275,895 | 1,275,694 |
| 80% | 79.7% | 1,134,129 | 1,130,469 |
| 70% | 69.9% | 992,363 | 991,310 |
| 60% | 60.1% | 850,597 | 852,227 |
| 50% | 50.2% | 708,831 | 711,469 |
| 40% | 40.0% | 567,064 | 566,667 |
| 30% | 30.0% | 425,298 | 424,749 |
| 20% | 19.9% | 283,532 | 282,224 |
| 10% | 10.0% | 141,766 | 142,121 |
| Active Idle | 0 | 0 | |
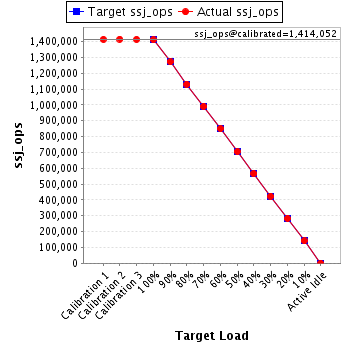
| Target Load | Actual Load | ssj_ops | |
|---|---|---|---|
| Target | Actual | ||
| Calibration 1 | 1,413,596 | ||
| Calibration 2 | 1,414,663 | ||
| Calibration 3 | 1,413,441 | ||
| ssj_ops@calibrated=1,414,052 | |||
| 100% | 99.7% | 1,414,052 | 1,410,476 |
| 90% | 89.9% | 1,272,647 | 1,271,674 |
| 80% | 79.9% | 1,131,242 | 1,130,194 |
| 70% | 70.1% | 989,837 | 991,443 |
| 60% | 60.0% | 848,431 | 848,992 |
| 50% | 49.8% | 707,026 | 704,485 |
| 40% | 40.0% | 565,621 | 565,448 |
| 30% | 30.0% | 424,216 | 423,799 |
| 20% | 20.0% | 282,810 | 283,348 |
| 10% | 10.0% | 141,405 | 141,491 |
| Active Idle | 0 | 0 | |