SPECpower_ssj2008
Host 'WIN-SUT103' Performance Report
Copyright © 2007-2019 Standard Performance Evaluation Corporation
| New H3C Technologies Co., Ltd. H3C UniServer B5700 G3 | ssj_ops@100% = 5,680,602 ssj_ops@100% per JVM = 1,420,151 |
||||
| Test Sponsor: | New H3C Technologies Co., Ltd. | SPEC License #: | 9066 | Test Method: | Multi Node |
| Tested By: | New H3C Technologies Co., Ltd. | Test Location: | Hangzhou, Zhejiang, China | Test Date: | Apr 27, 2019 |
| Hardware Availability: | Jan-2019 | Software Availability: | Jan-2019 | Publication: | Jun 5, 2019 |
| System Source: | Single Supplier | System Designation: | Server | Power Provisioning: | Line-powered |
| Target Load | Actual Load | ssj_ops | |
|---|---|---|---|
| Target | Actual | ||
| Calibration 1 | 5,703,268 | ||
| Calibration 2 | 5,696,629 | ||
| Calibration 3 | 5,710,012 | ||
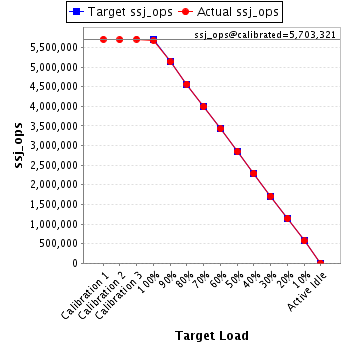
| ssj_ops@calibrated=5,703,321 | |||
| 100% | 99.6% | 5,703,321 | 5,680,602 |
| 90% | 90.0% | 5,132,989 | 5,133,369 |
| 80% | 80.0% | 4,562,657 | 4,563,784 |
| 70% | 70.0% | 3,992,325 | 3,991,777 |
| 60% | 60.0% | 3,421,992 | 3,424,829 |
| 50% | 49.9% | 2,851,660 | 2,847,025 |
| 40% | 40.1% | 2,281,328 | 2,285,910 |
| 30% | 30.0% | 1,710,996 | 1,712,838 |
| 20% | 20.0% | 1,140,664 | 1,143,439 |
| 10% | 10.0% | 570,332 | 571,129 |
| Active Idle | 0 | 0 | |
| Set Identifier: | sut |
| Set Description: | System Under Test |
| # of Identical Nodes: | 8 |
| Comment: | SUT |
| Hardware | |
|---|---|
| Hardware Vendor: | New H3C Technologies Co., Ltd. |
| Model: | H3C UniServer B5700 G3 |
| Form Factor: | Other |
| CPU Name: | Intel Xeon Platinum 8180 2.50GHz |
| CPU Characteristics: | 28-Core, 2.50 GHz, 38.5 MB L3 Cache |
| CPU Frequency (MHz): | 2500 |
| CPU(s) Enabled: | 56 cores, 2 chips, 28 cores/chip |
| Hardware Threads: | 112 (2 / core) |
| CPU(s) Orderable: | 1,2 chips |
| Primary Cache: | 32 KB I + 32 KB D on chip per core |
| Secondary Cache: | 1 MB I+D on chip per core |
| Tertiary Cache: | 39424 KB I+D on chip per chip |
| Other Cache: | None |
| Memory Amount (GB): | 192.0 |
| # and size of DIMM: | 12 x 16384 MB |
| Memory Details: | 12 x 16GB 2Rx8 PC4-2666-V ECC;slots A1, A2, A3, A4, A5, A6, B1, B2, B3, B4, B5, B6 populated |
| Power Supply Quantity and Rating (W): | None |
| Power Supply Details: | Shared |
| Disk Drive: | SATA DOM 128GB P/N DESSH-A28D09BCADCA |
| Disk Controller: | Integrated SATA controller |
| # and type of Network Interface Cards (NICs) Installed: | 1 x Intel I350 Gigabit Ethernet Controller |
| NICs Enabled in Firmware / OS / Connected: | 2/2/1 |
| Network Speed (Mbit): | 1000 |
| Keyboard: | None |
| Mouse: | None |
| Monitor: | None |
| Optical Drives: | No |
| Other Hardware: | None |
| Software | |
|---|---|
| Power Management: | Balanced Mode enabled in OS (see SUT Notes) |
| Operating System (OS): | Microsoft Windows Server 2012 R2 Datacenter |
| OS Version: | Version 6.3 (Build 9600) |
| Filesystem: | NTFS |
| JVM Vendor: | Oracle Corporation |
| JVM Version: | Java HotSpot(TM) 64-Bit Server VM (build 24.80-b11, mixed mode), version 1.7.0_80 |
| JVM Command-line Options: | -server -Xmn19g -Xms21g -Xmx21g -XX:SurvivorRatio=1 -XX:TargetSurvivorRatio=99 -XX:ParallelGCThreads=28 -XX:AllocatePrefetchDistance=256 -XX:AllocatePrefetchLines=4 -XX:LoopUnrollLimit=45 -XX:InitialTenuringThreshold=12 -XX:MaxTenuringThreshold=15 -XX:InlineSmallCode=9000 -XX:MaxInlineSize=270 -XX:FreqInlineSize=6000 -XX:+UseLargePages -XX:+UseParallelOldGC -XX:+AggressiveOpts |
| JVM Affinity: | start /NODE [0,2] /AFFINITY [0xFC0FF00FC0FF];start /NODE [1,3] /AFFINITY [0xFF03F00FF03F] |
| JVM Instances: | 4 |
| JVM Initial Heap (MB): | 21000 |
| JVM Maximum Heap (MB): | 21000 |
| JVM Address Bits: | 64 |
| Boot Firmware Version: | 2.00.25 |
| Management Firmware Version: | UIS-OM 1.00.10 |
| Workload Version: | SSJ 1.2.10 |
| Director Location: | Controller |
| Other Software: | Microsoft Windows KB3021910, clearcompressionflag.exe, KB2919355, KB2932046, KB2959977, KB2937592, KB2938439, KB2934018, KB4056898, patched to this test system in April 26, 2019 |
| JVM Instance | ssj_ops@100% |
|---|---|
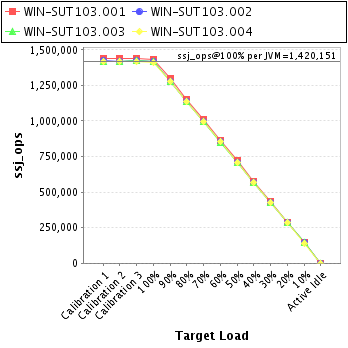
| WIN-SUT103.001 | 1,431,970 |
| WIN-SUT103.002 | 1,419,923 |
| WIN-SUT103.003 | 1,416,124 |
| WIN-SUT103.004 | 1,412,585 |
| ssj_ops@100% | 5,680,602 |
| ssj_ops@100% per JVM | 1,420,151 |
| Target Load | Actual Load | ssj_ops | |
|---|---|---|---|
| Target | Actual | ||
| Calibration 1 | 1,439,682 | ||
| Calibration 2 | 1,436,985 | ||
| Calibration 3 | 1,441,265 | ||
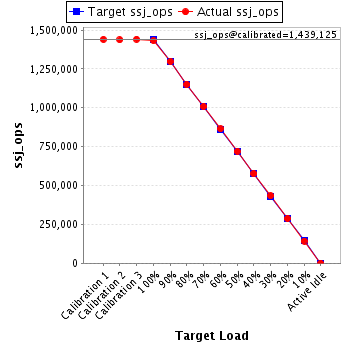
| ssj_ops@calibrated=1,439,125 | |||
| 100% | 99.5% | 1,439,125 | 1,431,970 |
| 90% | 90.2% | 1,295,212 | 1,297,749 |
| 80% | 79.9% | 1,151,300 | 1,150,473 |
| 70% | 70.1% | 1,007,387 | 1,008,780 |
| 60% | 60.0% | 863,475 | 863,940 |
| 50% | 50.0% | 719,562 | 720,111 |
| 40% | 40.0% | 575,650 | 575,298 |
| 30% | 30.1% | 431,737 | 433,667 |
| 20% | 20.0% | 287,825 | 287,235 |
| 10% | 9.9% | 143,912 | 143,125 |
| Active Idle | 0 | 0 | |
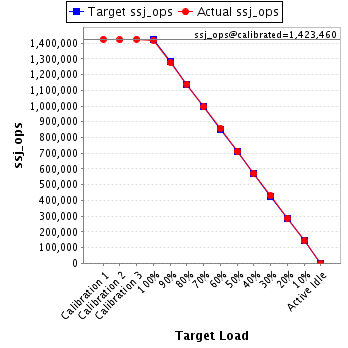
| Target Load | Actual Load | ssj_ops | |
|---|---|---|---|
| Target | Actual | ||
| Calibration 1 | 1,424,614 | ||
| Calibration 2 | 1,421,376 | ||
| Calibration 3 | 1,425,544 | ||
| ssj_ops@calibrated=1,423,460 | |||
| 100% | 99.8% | 1,423,460 | 1,419,923 |
| 90% | 89.8% | 1,281,114 | 1,277,775 |
| 80% | 80.1% | 1,138,768 | 1,139,710 |
| 70% | 69.9% | 996,422 | 994,443 |
| 60% | 60.1% | 854,076 | 855,176 |
| 50% | 49.9% | 711,730 | 710,821 |
| 40% | 40.0% | 569,384 | 569,914 |
| 30% | 30.1% | 427,038 | 428,199 |
| 20% | 20.2% | 284,692 | 287,212 |
| 10% | 10.0% | 142,346 | 142,896 |
| Active Idle | 0 | 0 | |
| Target Load | Actual Load | ssj_ops | |
|---|---|---|---|
| Target | Actual | ||
| Calibration 1 | 1,420,805 | ||
| Calibration 2 | 1,418,710 | ||
| Calibration 3 | 1,422,914 | ||
| ssj_ops@calibrated=1,420,812 | |||
| 100% | 99.7% | 1,420,812 | 1,416,124 |
| 90% | 90.0% | 1,278,731 | 1,278,066 |
| 80% | 80.1% | 1,136,650 | 1,137,978 |
| 70% | 70.0% | 994,568 | 994,734 |
| 60% | 60.0% | 852,487 | 851,980 |
| 50% | 49.8% | 710,406 | 708,201 |
| 40% | 40.1% | 568,325 | 570,390 |
| 30% | 29.9% | 426,244 | 424,849 |
| 20% | 20.0% | 284,162 | 283,981 |
| 10% | 10.1% | 142,081 | 143,155 |
| Active Idle | 0 | 0 | |

| Target Load | Actual Load | ssj_ops | |
|---|---|---|---|
| Target | Actual | ||
| Calibration 1 | 1,418,166 | ||
| Calibration 2 | 1,419,558 | ||
| Calibration 3 | 1,420,290 | ||
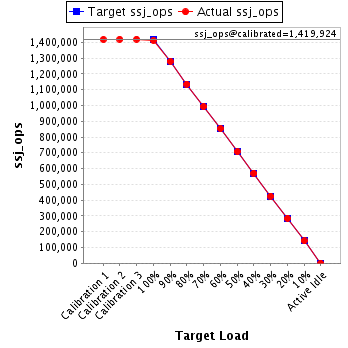
| ssj_ops@calibrated=1,419,924 | |||
| 100% | 99.5% | 1,419,924 | 1,412,585 |
| 90% | 90.1% | 1,277,931 | 1,279,780 |
| 80% | 80.0% | 1,135,939 | 1,135,623 |
| 70% | 70.0% | 993,947 | 993,821 |
| 60% | 60.1% | 851,954 | 853,733 |
| 50% | 49.9% | 709,962 | 707,892 |
| 40% | 40.2% | 567,970 | 570,308 |
| 30% | 30.0% | 425,977 | 426,123 |
| 20% | 20.1% | 283,985 | 285,011 |
| 10% | 10.0% | 141,992 | 141,953 |
| Active Idle | 0 | 0 | |