SPECpower_ssj2008
Host 'WIN-SUT102' Performance Report
Copyright © 2007-2019 Standard Performance Evaluation Corporation
| New H3C Technologies Co., Ltd. H3C UniServer B5700 G3 | ssj_ops@100% = 5,704,044 ssj_ops@100% per JVM = 1,426,011 |
||||
| Test Sponsor: | New H3C Technologies Co., Ltd. | SPEC License #: | 9066 | Test Method: | Multi Node |
| Tested By: | New H3C Technologies Co., Ltd. | Test Location: | Hangzhou, Zhejiang, China | Test Date: | Apr 27, 2019 |
| Hardware Availability: | Jan-2019 | Software Availability: | Jan-2019 | Publication: | Jun 5, 2019 |
| System Source: | Single Supplier | System Designation: | Server | Power Provisioning: | Line-powered |
| Target Load | Actual Load | ssj_ops | |
|---|---|---|---|
| Target | Actual | ||
| Calibration 1 | 5,723,826 | ||
| Calibration 2 | 5,715,675 | ||
| Calibration 3 | 5,722,333 | ||
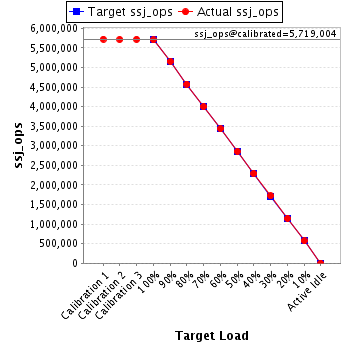
| ssj_ops@calibrated=5,719,004 | |||
| 100% | 99.7% | 5,719,004 | 5,704,044 |
| 90% | 90.1% | 5,147,104 | 5,155,609 |
| 80% | 80.0% | 4,575,203 | 4,574,779 |
| 70% | 70.0% | 4,003,303 | 4,000,599 |
| 60% | 60.0% | 3,431,402 | 3,431,953 |
| 50% | 50.0% | 2,859,502 | 2,858,969 |
| 40% | 40.0% | 2,287,602 | 2,289,700 |
| 30% | 30.1% | 1,715,701 | 1,719,577 |
| 20% | 20.0% | 1,143,801 | 1,145,987 |
| 10% | 10.0% | 571,900 | 572,444 |
| Active Idle | 0 | 0 | |
| Set Identifier: | sut |
| Set Description: | System Under Test |
| # of Identical Nodes: | 8 |
| Comment: | SUT |
| Hardware | |
|---|---|
| Hardware Vendor: | New H3C Technologies Co., Ltd. |
| Model: | H3C UniServer B5700 G3 |
| Form Factor: | Other |
| CPU Name: | Intel Xeon Platinum 8180 2.50GHz |
| CPU Characteristics: | 28-Core, 2.50 GHz, 38.5 MB L3 Cache |
| CPU Frequency (MHz): | 2500 |
| CPU(s) Enabled: | 56 cores, 2 chips, 28 cores/chip |
| Hardware Threads: | 112 (2 / core) |
| CPU(s) Orderable: | 1,2 chips |
| Primary Cache: | 32 KB I + 32 KB D on chip per core |
| Secondary Cache: | 1 MB I+D on chip per core |
| Tertiary Cache: | 39424 KB I+D on chip per chip |
| Other Cache: | None |
| Memory Amount (GB): | 192.0 |
| # and size of DIMM: | 12 x 16384 MB |
| Memory Details: | 12 x 16GB 2Rx8 PC4-2666-V ECC;slots A1, A2, A3, A4, A5, A6, B1, B2, B3, B4, B5, B6 populated |
| Power Supply Quantity and Rating (W): | None |
| Power Supply Details: | Shared |
| Disk Drive: | SATA DOM 128GB P/N DESSH-A28D09BCADCA |
| Disk Controller: | Integrated SATA controller |
| # and type of Network Interface Cards (NICs) Installed: | 1 x Intel I350 Gigabit Ethernet Controller |
| NICs Enabled in Firmware / OS / Connected: | 2/2/1 |
| Network Speed (Mbit): | 1000 |
| Keyboard: | None |
| Mouse: | None |
| Monitor: | None |
| Optical Drives: | No |
| Other Hardware: | None |
| Software | |
|---|---|
| Power Management: | Balanced Mode enabled in OS (see SUT Notes) |
| Operating System (OS): | Microsoft Windows Server 2012 R2 Datacenter |
| OS Version: | Version 6.3 (Build 9600) |
| Filesystem: | NTFS |
| JVM Vendor: | Oracle Corporation |
| JVM Version: | Java HotSpot(TM) 64-Bit Server VM (build 24.80-b11, mixed mode), version 1.7.0_80 |
| JVM Command-line Options: | -server -Xmn19g -Xms21g -Xmx21g -XX:SurvivorRatio=1 -XX:TargetSurvivorRatio=99 -XX:ParallelGCThreads=28 -XX:AllocatePrefetchDistance=256 -XX:AllocatePrefetchLines=4 -XX:LoopUnrollLimit=45 -XX:InitialTenuringThreshold=12 -XX:MaxTenuringThreshold=15 -XX:InlineSmallCode=9000 -XX:MaxInlineSize=270 -XX:FreqInlineSize=6000 -XX:+UseLargePages -XX:+UseParallelOldGC -XX:+AggressiveOpts |
| JVM Affinity: | start /NODE [0,2] /AFFINITY [0xFC0FF00FC0FF];start /NODE [1,3] /AFFINITY [0xFF03F00FF03F] |
| JVM Instances: | 4 |
| JVM Initial Heap (MB): | 21000 |
| JVM Maximum Heap (MB): | 21000 |
| JVM Address Bits: | 64 |
| Boot Firmware Version: | 2.00.25 |
| Management Firmware Version: | UIS-OM 1.00.10 |
| Workload Version: | SSJ 1.2.10 |
| Director Location: | Controller |
| Other Software: | Microsoft Windows KB3021910, clearcompressionflag.exe, KB2919355, KB2932046, KB2959977, KB2937592, KB2938439, KB2934018, KB4056898, patched to this test system in April 26, 2019 |
| JVM Instance | ssj_ops@100% |
|---|---|
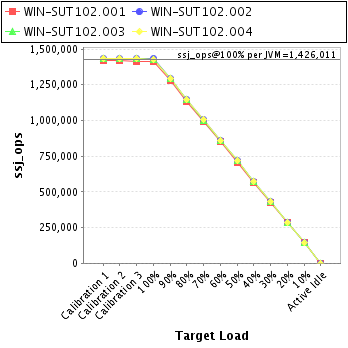
| WIN-SUT102.001 | 1,414,900 |
| WIN-SUT102.002 | 1,431,715 |
| WIN-SUT102.003 | 1,429,480 |
| WIN-SUT102.004 | 1,427,949 |
| ssj_ops@100% | 5,704,044 |
| ssj_ops@100% per JVM | 1,426,011 |
| Target Load | Actual Load | ssj_ops | |
|---|---|---|---|
| Target | Actual | ||
| Calibration 1 | 1,419,628 | ||
| Calibration 2 | 1,416,973 | ||
| Calibration 3 | 1,416,222 | ||
| ssj_ops@calibrated=1,416,597 | |||
| 100% | 99.9% | 1,416,597 | 1,414,900 |
| 90% | 90.2% | 1,274,938 | 1,277,271 |
| 80% | 79.8% | 1,133,278 | 1,130,737 |
| 70% | 69.9% | 991,618 | 990,161 |
| 60% | 60.1% | 849,958 | 850,733 |
| 50% | 49.8% | 708,299 | 705,910 |
| 40% | 40.0% | 566,639 | 566,728 |
| 30% | 30.0% | 424,979 | 424,874 |
| 20% | 20.0% | 283,319 | 283,401 |
| 10% | 10.1% | 141,660 | 142,585 |
| Active Idle | 0 | 0 | |
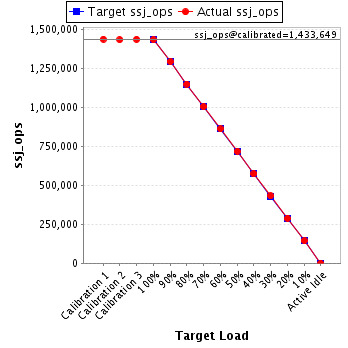
| Target Load | Actual Load | ssj_ops | |
|---|---|---|---|
| Target | Actual | ||
| Calibration 1 | 1,435,720 | ||
| Calibration 2 | 1,431,999 | ||
| Calibration 3 | 1,435,298 | ||
| ssj_ops@calibrated=1,433,649 | |||
| 100% | 99.9% | 1,433,649 | 1,431,715 |
| 90% | 90.1% | 1,290,284 | 1,291,478 |
| 80% | 80.1% | 1,146,919 | 1,147,933 |
| 70% | 70.0% | 1,003,554 | 1,003,253 |
| 60% | 60.0% | 860,189 | 860,488 |
| 50% | 50.1% | 716,824 | 717,648 |
| 40% | 39.9% | 573,459 | 572,599 |
| 30% | 30.1% | 430,095 | 431,121 |
| 20% | 20.1% | 286,730 | 288,841 |
| 10% | 10.0% | 143,365 | 143,930 |
| Active Idle | 0 | 0 | |
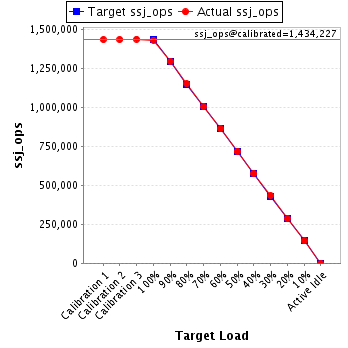
| Target Load | Actual Load | ssj_ops | |
|---|---|---|---|
| Target | Actual | ||
| Calibration 1 | 1,432,485 | ||
| Calibration 2 | 1,433,135 | ||
| Calibration 3 | 1,435,319 | ||
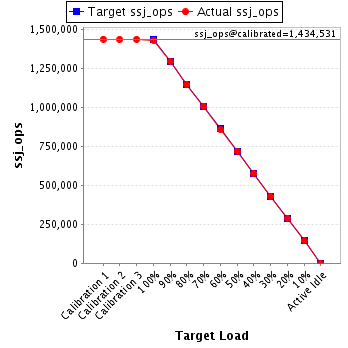
| ssj_ops@calibrated=1,434,227 | |||
| 100% | 99.7% | 1,434,227 | 1,429,480 |
| 90% | 90.2% | 1,290,804 | 1,293,500 |
| 80% | 80.2% | 1,147,381 | 1,150,145 |
| 70% | 69.8% | 1,003,959 | 1,001,567 |
| 60% | 60.1% | 860,536 | 862,532 |
| 50% | 50.0% | 717,113 | 717,202 |
| 40% | 40.1% | 573,691 | 575,285 |
| 30% | 30.2% | 430,268 | 433,658 |
| 20% | 19.9% | 286,845 | 285,525 |
| 10% | 10.0% | 143,423 | 143,120 |
| Active Idle | 0 | 0 | |
| Target Load | Actual Load | ssj_ops | |
|---|---|---|---|
| Target | Actual | ||
| Calibration 1 | 1,435,994 | ||
| Calibration 2 | 1,433,568 | ||
| Calibration 3 | 1,435,494 | ||
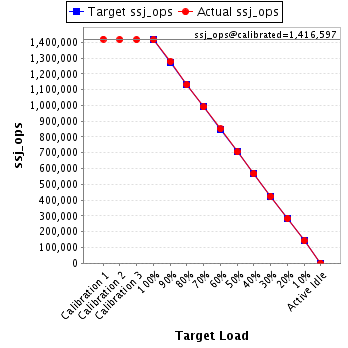
| ssj_ops@calibrated=1,434,531 | |||
| 100% | 99.5% | 1,434,531 | 1,427,949 |
| 90% | 90.2% | 1,291,078 | 1,293,360 |
| 80% | 79.9% | 1,147,625 | 1,145,963 |
| 70% | 70.1% | 1,004,172 | 1,005,618 |
| 60% | 59.8% | 860,719 | 858,200 |
| 50% | 50.1% | 717,266 | 718,210 |
| 40% | 40.1% | 573,812 | 575,088 |
| 30% | 30.0% | 430,359 | 429,924 |
| 20% | 20.1% | 286,906 | 288,220 |
| 10% | 10.0% | 143,453 | 142,809 |
| Active Idle | 0 | 0 | |