
SPECpower_ssj2008
Host 'NODE03' Performance Report
Copyright © 2007-2019 Standard Performance Evaluation Corporation
| Hewlett Packard Enterprise Synergy 480 Gen10 Compute Module | ssj_ops@100% = 5,772,441 ssj_ops@100% per JVM = 1,443,110 |
||||
| Test Sponsor: | Hewlett Packard Enterprise | SPEC License #: | 3 | Test Method: | Multi Node |
| Tested By: | Hewlett Packard Enterprise | Test Location: | Houston, TX, USA | Test Date: | Mar 28, 2019 |
| Hardware Availability: | Apr-2019 | Software Availability: | Mar-2019 | Publication: | May 8, 2019 |
| System Source: | Single Supplier | System Designation: | Server | Power Provisioning: | Line-powered |
| Target Load | Actual Load | ssj_ops | |
|---|---|---|---|
| Target | Actual | ||
| Calibration 1 | 5,797,121 | ||
| Calibration 2 | 5,783,919 | ||
| Calibration 3 | 5,784,234 | ||
| ssj_ops@calibrated=5,784,077 | |||
| 100% | 99.8% | 5,784,077 | 5,772,441 |
| 90% | 89.9% | 5,205,669 | 5,202,130 |
| 80% | 80.0% | 4,627,261 | 4,624,920 |
| 70% | 70.0% | 4,048,854 | 4,050,548 |
| 60% | 60.1% | 3,470,446 | 3,473,953 |
| 50% | 49.9% | 2,892,038 | 2,888,674 |
| 40% | 40.0% | 2,313,631 | 2,315,091 |
| 30% | 30.0% | 1,735,223 | 1,737,910 |
| 20% | 20.0% | 1,156,815 | 1,157,985 |
| 10% | 10.1% | 578,408 | 582,879 |
| Active Idle | 0 | 0 | |

| Set Identifier: | SUT |
| Set Description: | System Under Test |
| # of Identical Nodes: | 3 |
| Comment: | SUT |
| Hardware | |
|---|---|
| Hardware Vendor: | Hewlett Packard Enterprise |
| Model: | Synergy 480 Gen10 Compute Module |
| Form Factor: | 7U |
| CPU Name: | Intel Xeon Platinum 8280 @ 2.70GHz (Intel Turbo Boost Technology up to 4.00 GHz) |
| CPU Characteristics: | 28-Core, 2.70 GHz, 38.5MB L3 Cache |
| CPU Frequency (MHz): | 2700 |
| CPU(s) Enabled: | 56 cores, 2 chips, 28 cores/chip |
| Hardware Threads: | 112 (2 / core) |
| CPU(s) Orderable: | 1,2 chips |
| Primary Cache: | 32 KB I + 32 KB D on chip per core |
| Secondary Cache: | 1 MB I+D on chip per core |
| Tertiary Cache: | 39424 KB I+D on chip per chip |
| Other Cache: | None |
| Memory Amount (GB): | 192 |
| # and size of DIMM: | 12 x 16384 MB |
| Memory Details: | 12 x 16GB 2Rx8 PC4-2933Y-R; slots 1, 3, 5, 8, 10 and 12 populated in each socket |
| Power Supply Quantity and Rating (W): | None |
| Power Supply Details: | N/A |
| Disk Drive: | 1 x HPE 240GB 6G SATA M.2 SSD (875488-B21) |
| Disk Controller: | HPE Smart Array S100i SR Gen10 |
| # and type of Network Interface Cards (NICs) Installed: | 1 x HPE Synergy 3820C 10/20Gb CNA |
| NICs Enabled in Firmware / OS / Connected: | 2/2/1 |
| Network Speed (Mbit): | 1000 |
| Keyboard: | None |
| Mouse: | None |
| Monitor: | None |
| Optical Drives: | No |
| Other Hardware: | H/S: Standard |
| Software | |
|---|---|
| Power Management: | Enabled (see SUT Notes) |
| Operating System (OS): | Windows Server 2012 R2 Datacenter |
| OS Version: | Version 6.3 (Build 9600) |
| Filesystem: | NTFS |
| JVM Vendor: | Oracle Corporation |
| JVM Version: | Oracle Java HotSpot(TM) 64-Bit Server VM (build 24.80-b11, mixed mode), version 1.7.0_80 |
| JVM Command-line Options: | -server -Xmn21000m -Xms24000m -Xmx24000m -XX:SurvivorRatio=1 -XX:TargetSurvivorRatio=99 -XX:AllocatePrefetchDistance=256 -XX:AllocatePrefetchLines=4 -XX:LoopUnrollLimit=45 -XX:InitialTenuringThreshold=12 -XX:MaxTenuringThreshold=15 -XX:ParallelGCThreads=28 -XX:InlineSmallCode=3900 -XX:MaxInlineSize=270 -XX:FreqInlineSize=2500 -XX:+AggressiveOpts -XX:+UseLargePages -XX:+UseParallelOldGC |
| JVM Affinity: | start /NODE [0,1,2,3] /AFFINITY [0xFFFFFFF] |
| JVM Instances: | 4 |
| JVM Initial Heap (MB): | 24000 |
| JVM Maximum Heap (MB): | 24000 |
| JVM Address Bits: | 64 |
| Boot Firmware Version: | I42 v2.00 (02/02/2019) |
| Management Firmware Version: | 1.40 Feb 05 2019 |
| Workload Version: | SSJ 1.2.10 |
| Director Location: | Controller |
| Other Software: | HPE Service Pack for ProLiant (SPP) Version: 2019.03.0, Microsoft Windows KB4056898, KB4338815 |
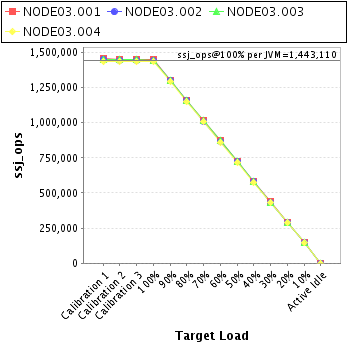
| JVM Instance | ssj_ops@100% |
|---|---|
| NODE03.001 | 1,448,969 |
| NODE03.002 | 1,441,505 |
| NODE03.003 | 1,444,736 |
| NODE03.004 | 1,437,231 |
| ssj_ops@100% | 5,772,441 |
| ssj_ops@100% per JVM | 1,443,110 |
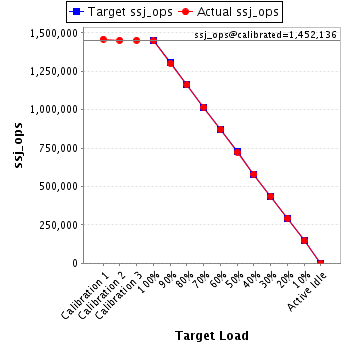
| Target Load | Actual Load | ssj_ops | |
|---|---|---|---|
| Target | Actual | ||
| Calibration 1 | 1,458,980 | ||
| Calibration 2 | 1,451,612 | ||
| Calibration 3 | 1,452,660 | ||
| ssj_ops@calibrated=1,452,136 | |||
| 100% | 99.8% | 1,452,136 | 1,448,969 |
| 90% | 89.7% | 1,306,922 | 1,301,913 |
| 80% | 80.0% | 1,161,709 | 1,161,109 |
| 70% | 70.0% | 1,016,495 | 1,017,210 |
| 60% | 60.0% | 871,282 | 871,500 |
| 50% | 49.9% | 726,068 | 724,294 |
| 40% | 40.0% | 580,854 | 580,393 |
| 30% | 30.0% | 435,641 | 436,030 |
| 20% | 20.1% | 290,427 | 291,384 |
| 10% | 10.1% | 145,214 | 146,674 |
| Active Idle | 0 | 0 | |
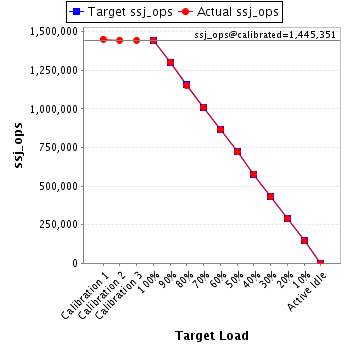
| Target Load | Actual Load | ssj_ops | |
|---|---|---|---|
| Target | Actual | ||
| Calibration 1 | 1,451,857 | ||
| Calibration 2 | 1,445,718 | ||
| Calibration 3 | 1,444,984 | ||
| ssj_ops@calibrated=1,445,351 | |||
| 100% | 99.7% | 1,445,351 | 1,441,505 |
| 90% | 90.0% | 1,300,816 | 1,301,185 |
| 80% | 79.9% | 1,156,281 | 1,154,766 |
| 70% | 69.9% | 1,011,746 | 1,010,548 |
| 60% | 59.9% | 867,211 | 865,560 |
| 50% | 49.9% | 722,675 | 721,238 |
| 40% | 40.0% | 578,140 | 578,257 |
| 30% | 29.9% | 433,605 | 432,813 |
| 20% | 20.0% | 289,070 | 288,792 |
| 10% | 10.1% | 144,535 | 146,240 |
| Active Idle | 0 | 0 | |
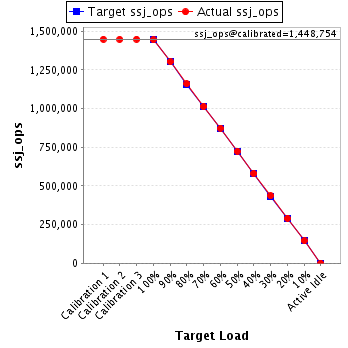
| Target Load | Actual Load | ssj_ops | |
|---|---|---|---|
| Target | Actual | ||
| Calibration 1 | 1,448,778 | ||
| Calibration 2 | 1,448,169 | ||
| Calibration 3 | 1,449,339 | ||
| ssj_ops@calibrated=1,448,754 | |||
| 100% | 99.7% | 1,448,754 | 1,444,736 |
| 90% | 90.0% | 1,303,879 | 1,303,562 |
| 80% | 80.1% | 1,159,003 | 1,161,128 |
| 70% | 70.0% | 1,014,128 | 1,014,515 |
| 60% | 60.4% | 869,252 | 874,603 |
| 50% | 50.0% | 724,377 | 724,307 |
| 40% | 40.0% | 579,502 | 579,977 |
| 30% | 30.1% | 434,626 | 435,821 |
| 20% | 20.1% | 289,751 | 290,874 |
| 10% | 10.0% | 144,875 | 145,565 |
| Active Idle | 0 | 0 | |
| Target Load | Actual Load | ssj_ops | |
|---|---|---|---|
| Target | Actual | ||
| Calibration 1 | 1,437,506 | ||
| Calibration 2 | 1,438,420 | ||
| Calibration 3 | 1,437,252 | ||
| ssj_ops@calibrated=1,437,836 | |||
| 100% | 100.0% | 1,437,836 | 1,437,231 |
| 90% | 90.1% | 1,294,052 | 1,295,470 |
| 80% | 79.8% | 1,150,269 | 1,147,916 |
| 70% | 70.1% | 1,006,485 | 1,008,276 |
| 60% | 60.0% | 862,702 | 862,290 |
| 50% | 50.0% | 718,918 | 718,835 |
| 40% | 40.1% | 575,134 | 576,465 |
| 30% | 30.1% | 431,351 | 433,246 |
| 20% | 20.0% | 287,567 | 286,935 |
| 10% | 10.0% | 143,784 | 144,401 |
| Active Idle | 0 | 0 | |
