SPECpower_ssj2008
Host 'Node06' Performance Report
Copyright © 2007-2018 Standard Performance Evaluation Corporation
| Hewlett Packard Enterprise Synergy 660 Gen10 Compute Module | ssj_ops@100% = 11,492,732 ssj_ops@100% per JVM = 1,436,591 |
||||
| Test Sponsor: | Hewlett Packard Enterprise | SPEC License #: | 3 | Test Method: | Multi Node |
| Tested By: | Hewlett Packard Enterprise | Test Location: | Houston, TX, USA | Test Date: | Aug 27, 2018 |
| Hardware Availability: | Jun-2018 | Software Availability: | Mar-2018 | Publication: | Sep 12, 2018 |
| System Source: | Single Supplier | System Designation: | Server | Power Provisioning: | Line-powered |
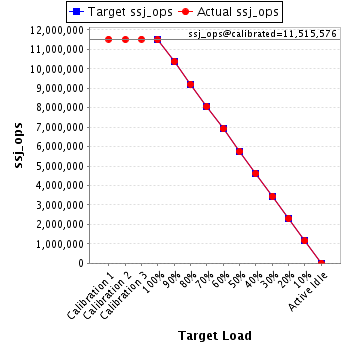
| Target Load | Actual Load | ssj_ops | |
|---|---|---|---|
| Target | Actual | ||
| Calibration 1 | 11,524,948 | ||
| Calibration 2 | 11,506,889 | ||
| Calibration 3 | 11,524,263 | ||
| ssj_ops@calibrated=11,515,576 | |||
| 100% | 99.8% | 11,515,576 | 11,492,732 |
| 90% | 90.1% | 10,364,018 | 10,381,056 |
| 80% | 80.0% | 9,212,461 | 9,215,270 |
| 70% | 69.9% | 8,060,903 | 8,054,303 |
| 60% | 60.0% | 6,909,346 | 6,912,036 |
| 50% | 49.9% | 5,757,788 | 5,751,597 |
| 40% | 40.1% | 4,606,230 | 4,615,439 |
| 30% | 29.9% | 3,454,673 | 3,446,616 |
| 20% | 20.0% | 2,303,115 | 2,300,322 |
| 10% | 10.0% | 1,151,558 | 1,153,537 |
| Active Idle | 0 | 0 | |
| Set Identifier: | SUT |
| Set Description: | System Under Test |
| # of Identical Nodes: | 3 |
| Comment: | SUT |
| Hardware | |
|---|---|
| Hardware Vendor: | Hewlett Packard Enterprise |
| Model: | Synergy 660 Gen10 Compute Module |
| Form Factor: | Other |
| CPU Name: | Intel Xeon Platinum 8180 2.50GHz |
| CPU Characteristics: | 28-Core, 2.50 GHz, 38.5MB L3 Cache |
| CPU Frequency (MHz): | 2500 |
| CPU(s) Enabled: | 112 cores, 4 chips, 28 cores/chip |
| Hardware Threads: | 224 (2 / core) |
| CPU(s) Orderable: | 1,2,3,4 chips |
| Primary Cache: | 32 KB I + 32 KB D on chip per core |
| Secondary Cache: | 1 MB I+D on chip per core |
| Tertiary Cache: | 39424 KB I+D on chip per chip |
| Other Cache: | None |
| Memory Amount (GB): | 384 |
| # and size of DIMM: | 24 x 16384 MB |
| Memory Details: | 24 x 16GB 2Rx8 PC4-2666-V ECC; slots 1, 3, 5, 8, 10 and 12 populated on each CPU socket |
| Power Supply Quantity and Rating (W): | None |
| Power Supply Details: | Shared |
| Disk Drive: | 1 x HPE 480GB SATA 6G Read Intensive M.2 (875319-B21) |
| Disk Controller: | 1 x HPE Smart Array S100i SR Gen10 (784308-B21) |
| # and type of Network Interface Cards (NICs) Installed: | 1 x HPE Synergy 3820C 10/20Gb 2-port Converged Network Adapter (777430-B21) |
| NICs Enabled in Firmware / OS / Connected: | 2/1/1 |
| Network Speed (Mbit): | 10000 |
| Keyboard: | None |
| Mouse: | None |
| Monitor: | None |
| Optical Drives: | No |
| Other Hardware: | None |
| Software | |
|---|---|
| Power Management: | Enabled (see SUT Notes) |
| Operating System (OS): | Windows Server 2012 R2 Datacenter |
| OS Version: | Version 6.3 (Build 9600) |
| Filesystem: | NTFS |
| JVM Vendor: | Oracle Corporation |
| JVM Version: | Oracle Java HotSpot(TM) 64-Bit Server VM (build 24.80-b11, mixed mode), version 1.7.0_80 |
| JVM Command-line Options: | -server -Xmn19g -Xms21g -Xmx21g -XX:SurvivorRatio=1 -XX:TargetSurvivorRatio=99 -XX:AllocatePrefetchDistance=256 -XX:AllocatePrefetchLines=4 -XX:LoopUnrollLimit=30 -XX:InitialTenuringThreshold=12 -XX:MaxTenuringThreshold=15 -XX:ParallelGCThreads=28 -XX:InlineSmallCode=3900 -XX:MaxInlineSize=270 -XX:FreqInlineSize=2500 -XX:+AggressiveOpts -XX:+UseLargePages -XX:+UseParallelOldGC |
| JVM Affinity: | start /NODE [0,2,4,6] /AFFINITY [0x0000000FC0FF, 0xFC0FF0000000]; start /NODE [1,3,5,7] /AFFINITY [0x0000000FF03F,0xFF03F0000000] |
| JVM Instances: | 8 |
| JVM Initial Heap (MB): | 21000 |
| JVM Maximum Heap (MB): | 21000 |
| JVM Address Bits: | 64 |
| Boot Firmware Version: | I43 v1.32 (02/01/2018) |
| Management Firmware Version: | 1.15 August 17 2017 |
| Workload Version: | SSJ 1.2.10 |
| Director Location: | Controller |
| Other Software: | HPE Composer Version 3.10.07 (HPE OneView) with HPE Synergy Custom SPP Bundle 2017.10.20180323; Microsoft Windows KB4054519, KB4056898 |
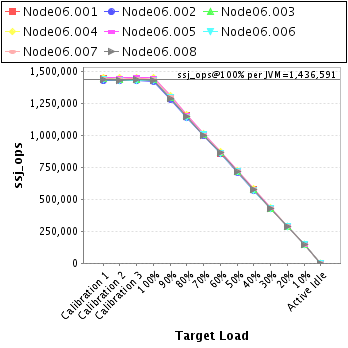
| JVM Instance | ssj_ops@100% |
|---|---|
| Node06.001 | 1,436,388 |
| Node06.002 | 1,423,497 |
| Node06.003 | 1,433,202 |
| Node06.004 | 1,451,724 |
| Node06.005 | 1,451,821 |
| Node06.006 | 1,429,205 |
| Node06.007 | 1,437,371 |
| Node06.008 | 1,429,524 |
| ssj_ops@100% | 11,492,732 |
| ssj_ops@100% per JVM | 1,436,591 |
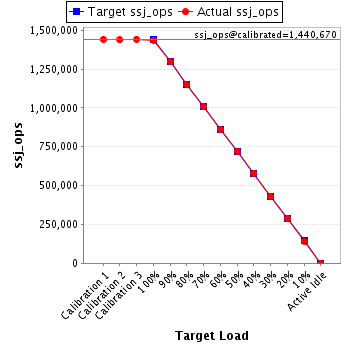
| Target Load | Actual Load | ssj_ops | |
|---|---|---|---|
| Target | Actual | ||
| Calibration 1 | 1,442,102 | ||
| Calibration 2 | 1,438,252 | ||
| Calibration 3 | 1,443,088 | ||
| ssj_ops@calibrated=1,440,670 | |||
| 100% | 99.7% | 1,440,670 | 1,436,388 |
| 90% | 90.1% | 1,296,603 | 1,298,029 |
| 80% | 80.1% | 1,152,536 | 1,153,579 |
| 70% | 69.9% | 1,008,469 | 1,006,903 |
| 60% | 59.8% | 864,402 | 860,884 |
| 50% | 50.0% | 720,335 | 720,374 |
| 40% | 40.3% | 576,268 | 580,146 |
| 30% | 29.8% | 432,201 | 430,005 |
| 20% | 20.0% | 288,134 | 288,299 |
| 10% | 9.9% | 144,067 | 143,243 |
| Active Idle | 0 | 0 | |
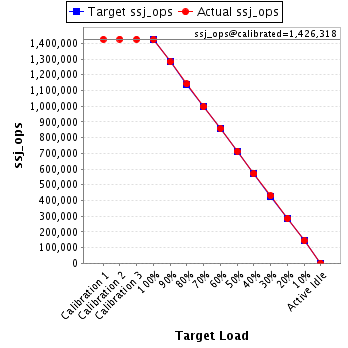
| Target Load | Actual Load | ssj_ops | |
|---|---|---|---|
| Target | Actual | ||
| Calibration 1 | 1,425,166 | ||
| Calibration 2 | 1,426,617 | ||
| Calibration 3 | 1,426,019 | ||
| ssj_ops@calibrated=1,426,318 | |||
| 100% | 99.8% | 1,426,318 | 1,423,497 |
| 90% | 89.9% | 1,283,686 | 1,282,097 |
| 80% | 80.0% | 1,141,054 | 1,141,422 |
| 70% | 69.9% | 998,423 | 997,343 |
| 60% | 60.2% | 855,791 | 858,241 |
| 50% | 50.0% | 713,159 | 713,283 |
| 40% | 39.9% | 570,527 | 569,694 |
| 30% | 30.1% | 427,895 | 428,772 |
| 20% | 20.0% | 285,264 | 284,956 |
| 10% | 10.1% | 142,632 | 143,880 |
| Active Idle | 0 | 0 | |
| Target Load | Actual Load | ssj_ops | |
|---|---|---|---|
| Target | Actual | ||
| Calibration 1 | 1,441,280 | ||
| Calibration 2 | 1,437,111 | ||
| Calibration 3 | 1,440,606 | ||
| ssj_ops@calibrated=1,438,858 | |||
| 100% | 99.6% | 1,438,858 | 1,433,202 |
| 90% | 90.2% | 1,294,973 | 1,298,144 |
| 80% | 80.1% | 1,151,087 | 1,151,916 |
| 70% | 69.9% | 1,007,201 | 1,006,111 |
| 60% | 60.0% | 863,315 | 863,467 |
| 50% | 49.8% | 719,429 | 717,124 |
| 40% | 40.1% | 575,543 | 577,607 |
| 30% | 30.0% | 431,658 | 431,240 |
| 20% | 19.9% | 287,772 | 286,324 |
| 10% | 10.0% | 143,886 | 143,769 |
| Active Idle | 0 | 0 | |

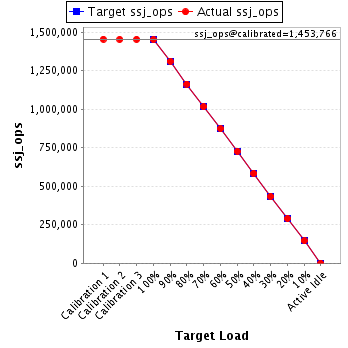
| Target Load | Actual Load | ssj_ops | |
|---|---|---|---|
| Target | Actual | ||
| Calibration 1 | 1,454,832 | ||
| Calibration 2 | 1,453,367 | ||
| Calibration 3 | 1,454,165 | ||
| ssj_ops@calibrated=1,453,766 | |||
| 100% | 99.9% | 1,453,766 | 1,451,724 |
| 90% | 90.2% | 1,308,389 | 1,311,799 |
| 80% | 80.1% | 1,163,013 | 1,163,759 |
| 70% | 69.9% | 1,017,636 | 1,016,518 |
| 60% | 60.1% | 872,260 | 873,120 |
| 50% | 50.0% | 726,883 | 726,786 |
| 40% | 40.1% | 581,506 | 582,549 |
| 30% | 29.8% | 436,130 | 433,892 |
| 20% | 20.0% | 290,753 | 290,034 |
| 10% | 10.0% | 145,377 | 145,911 |
| Active Idle | 0 | 0 | |
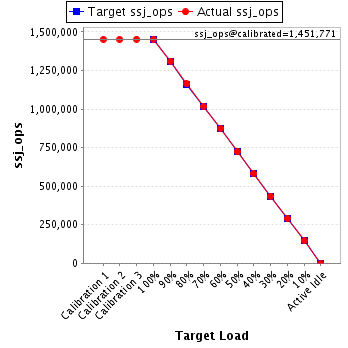
| Target Load | Actual Load | ssj_ops | |
|---|---|---|---|
| Target | Actual | ||
| Calibration 1 | 1,451,053 | ||
| Calibration 2 | 1,450,851 | ||
| Calibration 3 | 1,452,691 | ||
| ssj_ops@calibrated=1,451,771 | |||
| 100% | 100.0% | 1,451,771 | 1,451,821 |
| 90% | 90.3% | 1,306,594 | 1,310,734 |
| 80% | 80.1% | 1,161,417 | 1,162,649 |
| 70% | 70.1% | 1,016,240 | 1,017,515 |
| 60% | 60.1% | 871,063 | 872,794 |
| 50% | 49.8% | 725,885 | 723,546 |
| 40% | 40.1% | 580,708 | 582,073 |
| 30% | 30.0% | 435,531 | 435,294 |
| 20% | 20.0% | 290,354 | 289,803 |
| 10% | 10.0% | 145,177 | 144,924 |
| Active Idle | 0 | 0 | |
| Target Load | Actual Load | ssj_ops | |
|---|---|---|---|
| Target | Actual | ||
| Calibration 1 | 1,434,363 | ||
| Calibration 2 | 1,429,636 | ||
| Calibration 3 | 1,432,692 | ||
| ssj_ops@calibrated=1,431,164 | |||
| 100% | 99.9% | 1,431,164 | 1,429,205 |
| 90% | 90.4% | 1,288,048 | 1,293,510 |
| 80% | 79.9% | 1,144,931 | 1,143,537 |
| 70% | 70.1% | 1,001,815 | 1,003,644 |
| 60% | 60.0% | 858,698 | 858,116 |
| 50% | 50.2% | 715,582 | 717,755 |
| 40% | 40.0% | 572,466 | 572,050 |
| 30% | 30.0% | 429,349 | 429,304 |
| 20% | 20.0% | 286,233 | 286,616 |
| 10% | 10.0% | 143,116 | 143,214 |
| Active Idle | 0 | 0 | |

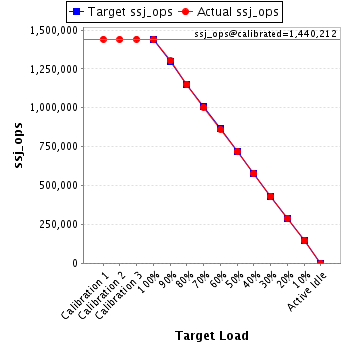
| Target Load | Actual Load | ssj_ops | |
|---|---|---|---|
| Target | Actual | ||
| Calibration 1 | 1,440,889 | ||
| Calibration 2 | 1,439,360 | ||
| Calibration 3 | 1,441,063 | ||
| ssj_ops@calibrated=1,440,212 | |||
| 100% | 99.8% | 1,440,212 | 1,437,371 |
| 90% | 90.3% | 1,296,191 | 1,300,993 |
| 80% | 79.9% | 1,152,169 | 1,150,587 |
| 70% | 69.7% | 1,008,148 | 1,004,026 |
| 60% | 59.9% | 864,127 | 862,738 |
| 50% | 49.9% | 720,106 | 718,541 |
| 40% | 40.1% | 576,085 | 576,825 |
| 30% | 29.9% | 432,064 | 430,050 |
| 20% | 20.0% | 288,042 | 288,723 |
| 10% | 10.1% | 144,021 | 144,938 |
| Active Idle | 0 | 0 | |
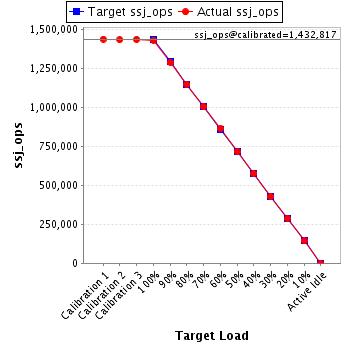
| Target Load | Actual Load | ssj_ops | |
|---|---|---|---|
| Target | Actual | ||
| Calibration 1 | 1,435,264 | ||
| Calibration 2 | 1,431,694 | ||
| Calibration 3 | 1,433,939 | ||
| ssj_ops@calibrated=1,432,817 | |||
| 100% | 99.8% | 1,432,817 | 1,429,524 |
| 90% | 89.7% | 1,289,535 | 1,285,750 |
| 80% | 80.1% | 1,146,253 | 1,147,821 |
| 70% | 69.9% | 1,002,972 | 1,002,242 |
| 60% | 60.2% | 859,690 | 862,675 |
| 50% | 49.8% | 716,408 | 714,188 |
| 40% | 40.1% | 573,127 | 574,496 |
| 30% | 29.9% | 429,845 | 428,060 |
| 20% | 19.9% | 286,563 | 285,567 |
| 10% | 10.0% | 143,282 | 143,657 |
| Active Idle | 0 | 0 | |