SPECpower_ssj2008
Host 'Node06' Performance Report
Copyright © 2007-2018 Standard Performance Evaluation Corporation
| Hewlett Packard Enterprise Synergy 660 Gen10 Compute Module | ssj_ops@100% = 11,500,373 ssj_ops@100% per JVM = 1,437,547 |
||||
| Test Sponsor: | Hewlett Packard Enterprise | SPEC License #: | 3 | Test Method: | Multi Node |
| Tested By: | Hewlett Packard Enterprise | Test Location: | Houston, TX, USA | Test Date: | Aug 27, 2018 |
| Hardware Availability: | Jun-2018 | Software Availability: | Mar-2018 | Publication: | Sep 12, 2018 |
| System Source: | Single Supplier | System Designation: | Server | Power Provisioning: | Line-powered |
| Target Load | Actual Load | ssj_ops | |
|---|---|---|---|
| Target | Actual | ||
| Calibration 1 | 11,538,899 | ||
| Calibration 2 | 11,528,924 | ||
| Calibration 3 | 11,536,474 | ||
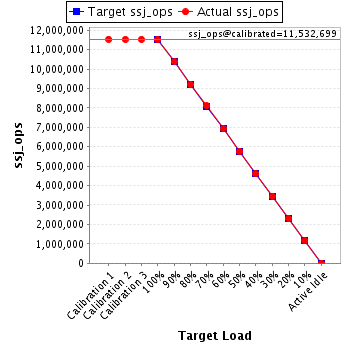
| ssj_ops@calibrated=11,532,699 | |||
| 100% | 99.7% | 11,532,699 | 11,500,373 |
| 90% | 90.0% | 10,379,429 | 10,383,011 |
| 80% | 79.9% | 9,226,159 | 9,217,834 |
| 70% | 70.3% | 8,072,889 | 8,107,937 |
| 60% | 60.0% | 6,919,619 | 6,920,484 |
| 50% | 50.0% | 5,766,349 | 5,763,981 |
| 40% | 40.0% | 4,613,079 | 4,612,926 |
| 30% | 30.0% | 3,459,810 | 3,455,777 |
| 20% | 20.0% | 2,306,540 | 2,306,283 |
| 10% | 10.0% | 1,153,270 | 1,155,639 |
| Active Idle | 0 | 0 | |
| Set Identifier: | SUT |
| Set Description: | System Under Test |
| # of Identical Nodes: | 4 |
| Comment: | SUT |
| Hardware | |
|---|---|
| Hardware Vendor: | Hewlett Packard Enterprise |
| Model: | Synergy 660 Gen10 Compute Module |
| Form Factor: | Other |
| CPU Name: | Intel Xeon Platinum 8180 2.50GHz |
| CPU Characteristics: | 28-Core, 2.50 GHz, 38.5MB L3 Cache |
| CPU Frequency (MHz): | 2500 |
| CPU(s) Enabled: | 112 cores, 4 chips, 28 cores/chip |
| Hardware Threads: | 224 (2 / core) |
| CPU(s) Orderable: | 1,2,3,4 chips |
| Primary Cache: | 32 KB I + 32 KB D on chip per core |
| Secondary Cache: | 1 MB I+D on chip per core |
| Tertiary Cache: | 39424 KB I+D on chip per chip |
| Other Cache: | None |
| Memory Amount (GB): | 384 |
| # and size of DIMM: | 24 x 16384 MB |
| Memory Details: | 24 x 16GB 2Rx8 PC4-2666-V ECC; slots 1, 3, 5, 8, 10 and 12 populated on each CPU socket |
| Power Supply Quantity and Rating (W): | None |
| Power Supply Details: | Shared |
| Disk Drive: | 1 x HPE 480GB SATA 6G Read Intensive M.2 (875319-B21) |
| Disk Controller: | 1 x HPE Smart Array S100i SR Gen10 (784308-B21) |
| # and type of Network Interface Cards (NICs) Installed: | 1 x HPE Synergy 3820C 10/20Gb 2-port Converged Network Adapter (777430-B21) |
| NICs Enabled in Firmware / OS / Connected: | 2/1/1 |
| Network Speed (Mbit): | 10000 |
| Keyboard: | None |
| Mouse: | None |
| Monitor: | None |
| Optical Drives: | No |
| Other Hardware: | None |
| Software | |
|---|---|
| Power Management: | Enabled (see SUT Notes) |
| Operating System (OS): | Windows Server 2012 R2 Datacenter |
| OS Version: | Version 6.3 (Build 9600) |
| Filesystem: | NTFS |
| JVM Vendor: | Oracle Corporation |
| JVM Version: | Oracle Java HotSpot(TM) 64-Bit Server VM (build 24.80-b11, mixed mode), version 1.7.0_80 |
| JVM Command-line Options: | -server -Xmn19g -Xms21g -Xmx21g -XX:SurvivorRatio=1 -XX:TargetSurvivorRatio=99 -XX:AllocatePrefetchDistance=256 -XX:AllocatePrefetchLines=4 -XX:LoopUnrollLimit=30 -XX:InitialTenuringThreshold=12 -XX:MaxTenuringThreshold=15 -XX:ParallelGCThreads=28 -XX:InlineSmallCode=3900 -XX:MaxInlineSize=270 -XX:FreqInlineSize=2500 -XX:+AggressiveOpts -XX:+UseLargePages -XX:+UseParallelOldGC |
| JVM Affinity: | start /NODE [0,2,4,6] /AFFINITY [0x0000000FC0FF, 0xFC0FF0000000]; start /NODE [1,3,5,7] /AFFINITY [0x0000000FF03F,0xFF03F0000000] |
| JVM Instances: | 8 |
| JVM Initial Heap (MB): | 21000 |
| JVM Maximum Heap (MB): | 21000 |
| JVM Address Bits: | 64 |
| Boot Firmware Version: | I43 v1.32 (02/01/2018) |
| Management Firmware Version: | 1.15 August 17 2017 |
| Workload Version: | SSJ 1.2.10 |
| Director Location: | Controller |
| Other Software: | HPE Composer Version 3.10.07 (HPE OneView) with HPE Synergy Custom SPP Bundle 2017.10.20180323; Microsoft Windows KB4054519, KB4056898 |
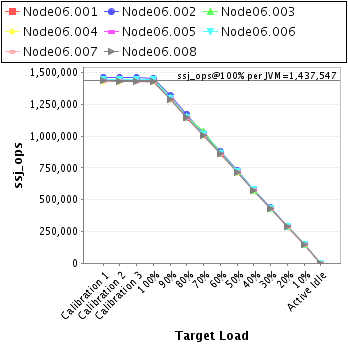
| JVM Instance | ssj_ops@100% |
|---|---|
| Node06.001 | 1,440,316 |
| Node06.002 | 1,457,411 |
| Node06.003 | 1,443,803 |
| Node06.004 | 1,431,054 |
| Node06.005 | 1,432,081 |
| Node06.006 | 1,442,173 |
| Node06.007 | 1,426,166 |
| Node06.008 | 1,427,370 |
| ssj_ops@100% | 11,500,373 |
| ssj_ops@100% per JVM | 1,437,547 |
| Target Load | Actual Load | ssj_ops | |
|---|---|---|---|
| Target | Actual | ||
| Calibration 1 | 1,443,166 | ||
| Calibration 2 | 1,442,683 | ||
| Calibration 3 | 1,442,880 | ||
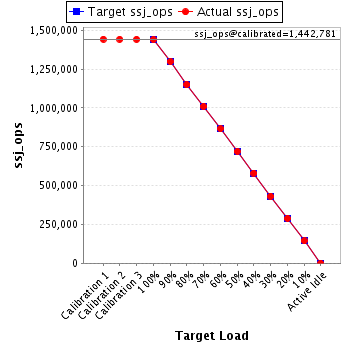
| ssj_ops@calibrated=1,442,781 | |||
| 100% | 99.8% | 1,442,781 | 1,440,316 |
| 90% | 90.0% | 1,298,503 | 1,298,800 |
| 80% | 79.7% | 1,154,225 | 1,150,160 |
| 70% | 70.1% | 1,009,947 | 1,010,797 |
| 60% | 60.0% | 865,669 | 865,514 |
| 50% | 49.9% | 721,391 | 720,527 |
| 40% | 40.2% | 577,113 | 580,262 |
| 30% | 30.0% | 432,834 | 432,327 |
| 20% | 20.1% | 288,556 | 289,308 |
| 10% | 10.0% | 144,278 | 144,116 |
| Active Idle | 0 | 0 | |
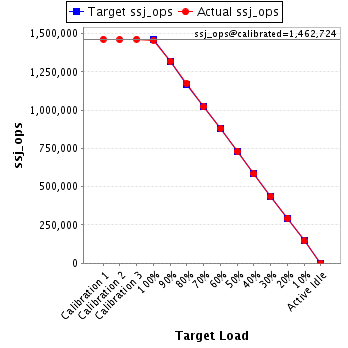
| Target Load | Actual Load | ssj_ops | |
|---|---|---|---|
| Target | Actual | ||
| Calibration 1 | 1,463,304 | ||
| Calibration 2 | 1,461,309 | ||
| Calibration 3 | 1,464,140 | ||
| ssj_ops@calibrated=1,462,724 | |||
| 100% | 99.6% | 1,462,724 | 1,457,411 |
| 90% | 90.2% | 1,316,452 | 1,319,489 |
| 80% | 80.3% | 1,170,180 | 1,174,436 |
| 70% | 69.9% | 1,023,907 | 1,021,950 |
| 60% | 60.2% | 877,635 | 880,970 |
| 50% | 50.0% | 731,362 | 731,172 |
| 40% | 39.9% | 585,090 | 584,128 |
| 30% | 29.9% | 438,817 | 437,622 |
| 20% | 20.0% | 292,545 | 292,897 |
| 10% | 10.0% | 146,272 | 146,385 |
| Active Idle | 0 | 0 | |
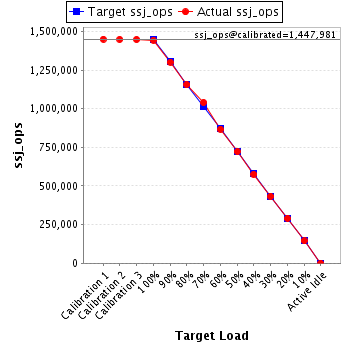
| Target Load | Actual Load | ssj_ops | |
|---|---|---|---|
| Target | Actual | ||
| Calibration 1 | 1,449,865 | ||
| Calibration 2 | 1,448,589 | ||
| Calibration 3 | 1,447,372 | ||
| ssj_ops@calibrated=1,447,981 | |||
| 100% | 99.7% | 1,447,981 | 1,443,803 |
| 90% | 89.9% | 1,303,183 | 1,301,424 |
| 80% | 79.8% | 1,158,384 | 1,155,623 |
| 70% | 71.9% | 1,013,586 | 1,040,510 |
| 60% | 59.9% | 868,788 | 867,653 |
| 50% | 49.9% | 723,990 | 721,994 |
| 40% | 39.8% | 579,192 | 576,201 |
| 30% | 30.0% | 434,394 | 433,833 |
| 20% | 20.1% | 289,596 | 290,953 |
| 10% | 10.0% | 144,798 | 145,074 |
| Active Idle | 0 | 0 | |
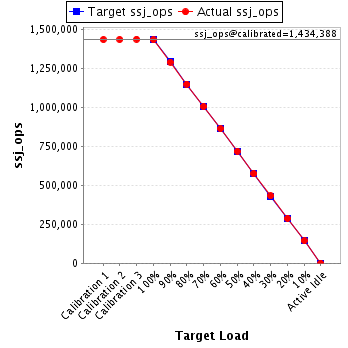
| Target Load | Actual Load | ssj_ops | |
|---|---|---|---|
| Target | Actual | ||
| Calibration 1 | 1,432,723 | ||
| Calibration 2 | 1,433,430 | ||
| Calibration 3 | 1,435,347 | ||
| ssj_ops@calibrated=1,434,388 | |||
| 100% | 99.8% | 1,434,388 | 1,431,054 |
| 90% | 89.8% | 1,290,950 | 1,288,574 |
| 80% | 80.0% | 1,147,511 | 1,147,569 |
| 70% | 70.0% | 1,004,072 | 1,004,788 |
| 60% | 60.1% | 860,633 | 861,942 |
| 50% | 50.0% | 717,194 | 717,679 |
| 40% | 40.0% | 573,755 | 573,451 |
| 30% | 30.0% | 430,317 | 430,907 |
| 20% | 20.0% | 286,878 | 287,506 |
| 10% | 10.0% | 143,439 | 144,095 |
| Active Idle | 0 | 0 | |
| Target Load | Actual Load | ssj_ops | |
|---|---|---|---|
| Target | Actual | ||
| Calibration 1 | 1,437,021 | ||
| Calibration 2 | 1,436,751 | ||
| Calibration 3 | 1,437,414 | ||
| ssj_ops@calibrated=1,437,082 | |||
| 100% | 99.7% | 1,437,082 | 1,432,081 |
| 90% | 90.3% | 1,293,374 | 1,296,988 |
| 80% | 79.7% | 1,149,666 | 1,144,932 |
| 70% | 70.1% | 1,005,958 | 1,006,714 |
| 60% | 59.9% | 862,249 | 861,459 |
| 50% | 49.9% | 718,541 | 717,763 |
| 40% | 39.9% | 574,833 | 573,618 |
| 30% | 29.8% | 431,125 | 428,604 |
| 20% | 20.0% | 287,416 | 287,104 |
| 10% | 10.0% | 143,708 | 144,262 |
| Active Idle | 0 | 0 | |

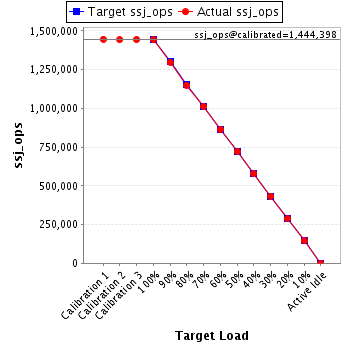
| Target Load | Actual Load | ssj_ops | |
|---|---|---|---|
| Target | Actual | ||
| Calibration 1 | 1,447,238 | ||
| Calibration 2 | 1,443,333 | ||
| Calibration 3 | 1,445,464 | ||
| ssj_ops@calibrated=1,444,398 | |||
| 100% | 99.8% | 1,444,398 | 1,442,173 |
| 90% | 89.9% | 1,299,959 | 1,299,183 |
| 80% | 79.7% | 1,155,519 | 1,150,492 |
| 70% | 70.2% | 1,011,079 | 1,013,803 |
| 60% | 59.9% | 866,639 | 864,619 |
| 50% | 50.0% | 722,199 | 721,784 |
| 40% | 40.0% | 577,759 | 577,127 |
| 30% | 30.1% | 433,320 | 434,149 |
| 20% | 19.9% | 288,880 | 287,145 |
| 10% | 10.0% | 144,440 | 144,053 |
| Active Idle | 0 | 0 | |
| Target Load | Actual Load | ssj_ops | |
|---|---|---|---|
| Target | Actual | ||
| Calibration 1 | 1,430,856 | ||
| Calibration 2 | 1,430,544 | ||
| Calibration 3 | 1,429,947 | ||
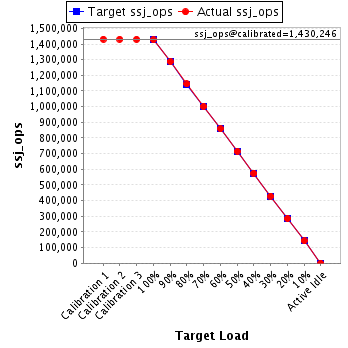
| ssj_ops@calibrated=1,430,246 | |||
| 100% | 99.7% | 1,430,246 | 1,426,166 |
| 90% | 90.0% | 1,287,221 | 1,287,467 |
| 80% | 80.0% | 1,144,197 | 1,144,848 |
| 70% | 70.1% | 1,001,172 | 1,002,168 |
| 60% | 60.0% | 858,147 | 858,384 |
| 50% | 50.0% | 715,123 | 715,229 |
| 40% | 40.2% | 572,098 | 574,493 |
| 30% | 30.0% | 429,074 | 429,342 |
| 20% | 19.9% | 286,049 | 284,897 |
| 10% | 10.0% | 143,025 | 143,214 |
| Active Idle | 0 | 0 | |
| Target Load | Actual Load | ssj_ops | |
|---|---|---|---|
| Target | Actual | ||
| Calibration 1 | 1,434,725 | ||
| Calibration 2 | 1,432,285 | ||
| Calibration 3 | 1,433,910 | ||
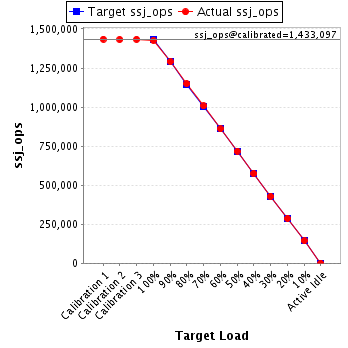
| ssj_ops@calibrated=1,433,097 | |||
| 100% | 99.6% | 1,433,097 | 1,427,370 |
| 90% | 90.1% | 1,289,787 | 1,291,087 |
| 80% | 80.2% | 1,146,478 | 1,149,775 |
| 70% | 70.3% | 1,003,168 | 1,007,207 |
| 60% | 60.0% | 859,858 | 859,943 |
| 50% | 50.1% | 716,549 | 717,833 |
| 40% | 40.0% | 573,239 | 573,646 |
| 30% | 29.9% | 429,929 | 428,993 |
| 20% | 20.0% | 286,619 | 286,473 |
| 10% | 10.1% | 143,310 | 144,440 |
| Active Idle | 0 | 0 | |