SPECpower_ssj2008
Host 'Node05' Performance Report
Copyright © 2007-2018 Standard Performance Evaluation Corporation
| Hewlett Packard Enterprise Synergy 660 Gen10 Compute Module | ssj_ops@100% = 11,542,753 ssj_ops@100% per JVM = 1,442,844 |
||||
| Test Sponsor: | Hewlett Packard Enterprise | SPEC License #: | 3 | Test Method: | Multi Node |
| Tested By: | Hewlett Packard Enterprise | Test Location: | Houston, TX, USA | Test Date: | Aug 27, 2018 |
| Hardware Availability: | Jun-2018 | Software Availability: | Mar-2018 | Publication: | Sep 12, 2018 |
| System Source: | Single Supplier | System Designation: | Server | Power Provisioning: | Line-powered |
| Target Load | Actual Load | ssj_ops | |
|---|---|---|---|
| Target | Actual | ||
| Calibration 1 | 11,570,505 | ||
| Calibration 2 | 11,565,198 | ||
| Calibration 3 | 11,580,033 | ||
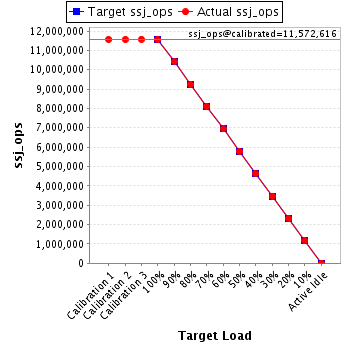
| ssj_ops@calibrated=11,572,616 | |||
| 100% | 99.7% | 11,572,616 | 11,542,753 |
| 90% | 90.0% | 10,415,354 | 10,412,662 |
| 80% | 80.0% | 9,258,093 | 9,253,673 |
| 70% | 70.0% | 8,100,831 | 8,102,679 |
| 60% | 60.0% | 6,943,570 | 6,947,240 |
| 50% | 50.0% | 5,786,308 | 5,789,541 |
| 40% | 40.0% | 4,629,046 | 4,631,114 |
| 30% | 30.0% | 3,471,785 | 3,474,706 |
| 20% | 20.0% | 2,314,523 | 2,316,407 |
| 10% | 10.0% | 1,157,262 | 1,156,628 |
| Active Idle | 0 | 0 | |
| Set Identifier: | SUT |
| Set Description: | System Under Test |
| # of Identical Nodes: | 4 |
| Comment: | SUT |
| Hardware | |
|---|---|
| Hardware Vendor: | Hewlett Packard Enterprise |
| Model: | Synergy 660 Gen10 Compute Module |
| Form Factor: | Other |
| CPU Name: | Intel Xeon Platinum 8180 2.50GHz |
| CPU Characteristics: | 28-Core, 2.50 GHz, 38.5MB L3 Cache |
| CPU Frequency (MHz): | 2500 |
| CPU(s) Enabled: | 112 cores, 4 chips, 28 cores/chip |
| Hardware Threads: | 224 (2 / core) |
| CPU(s) Orderable: | 1,2,3,4 chips |
| Primary Cache: | 32 KB I + 32 KB D on chip per core |
| Secondary Cache: | 1 MB I+D on chip per core |
| Tertiary Cache: | 39424 KB I+D on chip per chip |
| Other Cache: | None |
| Memory Amount (GB): | 384 |
| # and size of DIMM: | 24 x 16384 MB |
| Memory Details: | 24 x 16GB 2Rx8 PC4-2666-V ECC; slots 1, 3, 5, 8, 10 and 12 populated on each CPU socket |
| Power Supply Quantity and Rating (W): | None |
| Power Supply Details: | Shared |
| Disk Drive: | 1 x HPE 480GB SATA 6G Read Intensive M.2 (875319-B21) |
| Disk Controller: | 1 x HPE Smart Array S100i SR Gen10 (784308-B21) |
| # and type of Network Interface Cards (NICs) Installed: | 1 x HPE Synergy 3820C 10/20Gb 2-port Converged Network Adapter (777430-B21) |
| NICs Enabled in Firmware / OS / Connected: | 2/1/1 |
| Network Speed (Mbit): | 10000 |
| Keyboard: | None |
| Mouse: | None |
| Monitor: | None |
| Optical Drives: | No |
| Other Hardware: | None |
| Software | |
|---|---|
| Power Management: | Enabled (see SUT Notes) |
| Operating System (OS): | Windows Server 2012 R2 Datacenter |
| OS Version: | Version 6.3 (Build 9600) |
| Filesystem: | NTFS |
| JVM Vendor: | Oracle Corporation |
| JVM Version: | Oracle Java HotSpot(TM) 64-Bit Server VM (build 24.80-b11, mixed mode), version 1.7.0_80 |
| JVM Command-line Options: | -server -Xmn19g -Xms21g -Xmx21g -XX:SurvivorRatio=1 -XX:TargetSurvivorRatio=99 -XX:AllocatePrefetchDistance=256 -XX:AllocatePrefetchLines=4 -XX:LoopUnrollLimit=30 -XX:InitialTenuringThreshold=12 -XX:MaxTenuringThreshold=15 -XX:ParallelGCThreads=28 -XX:InlineSmallCode=3900 -XX:MaxInlineSize=270 -XX:FreqInlineSize=2500 -XX:+AggressiveOpts -XX:+UseLargePages -XX:+UseParallelOldGC |
| JVM Affinity: | start /NODE [0,2,4,6] /AFFINITY [0x0000000FC0FF, 0xFC0FF0000000]; start /NODE [1,3,5,7] /AFFINITY [0x0000000FF03F,0xFF03F0000000] |
| JVM Instances: | 8 |
| JVM Initial Heap (MB): | 21000 |
| JVM Maximum Heap (MB): | 21000 |
| JVM Address Bits: | 64 |
| Boot Firmware Version: | I43 v1.32 (02/01/2018) |
| Management Firmware Version: | 1.15 August 17 2017 |
| Workload Version: | SSJ 1.2.10 |
| Director Location: | Controller |
| Other Software: | HPE Composer Version 3.10.07 (HPE OneView) with HPE Synergy Custom SPP Bundle 2017.10.20180323; Microsoft Windows KB4054519, KB4056898 |
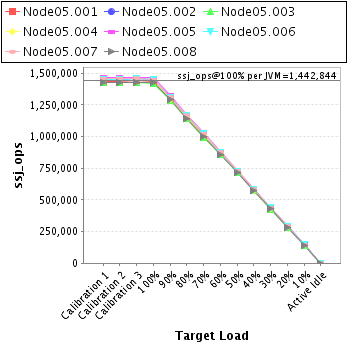
| JVM Instance | ssj_ops@100% |
|---|---|
| Node05.001 | 1,435,803 |
| Node05.002 | 1,451,502 |
| Node05.003 | 1,422,062 |
| Node05.004 | 1,441,072 |
| Node05.005 | 1,466,385 |
| Node05.006 | 1,450,387 |
| Node05.007 | 1,446,896 |
| Node05.008 | 1,428,645 |
| ssj_ops@100% | 11,542,753 |
| ssj_ops@100% per JVM | 1,442,844 |
| Target Load | Actual Load | ssj_ops | |
|---|---|---|---|
| Target | Actual | ||
| Calibration 1 | 1,437,606 | ||
| Calibration 2 | 1,436,390 | ||
| Calibration 3 | 1,440,339 | ||
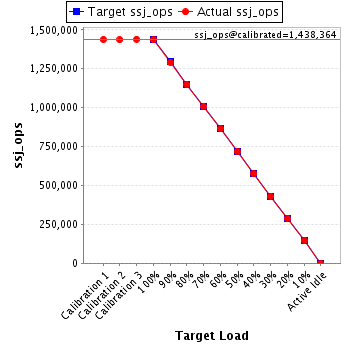
| ssj_ops@calibrated=1,438,364 | |||
| 100% | 99.8% | 1,438,364 | 1,435,803 |
| 90% | 89.7% | 1,294,528 | 1,290,725 |
| 80% | 80.0% | 1,150,691 | 1,151,215 |
| 70% | 70.0% | 1,006,855 | 1,007,043 |
| 60% | 60.1% | 863,019 | 864,579 |
| 50% | 50.0% | 719,182 | 719,313 |
| 40% | 40.0% | 575,346 | 575,490 |
| 30% | 30.0% | 431,509 | 431,033 |
| 20% | 20.0% | 287,673 | 288,025 |
| 10% | 10.2% | 143,836 | 146,108 |
| Active Idle | 0 | 0 | |
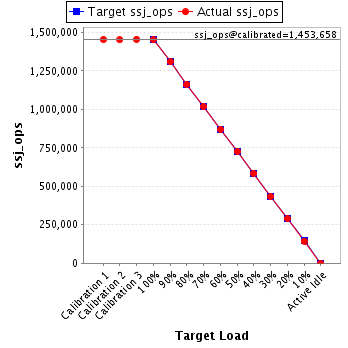
| Target Load | Actual Load | ssj_ops | |
|---|---|---|---|
| Target | Actual | ||
| Calibration 1 | 1,453,221 | ||
| Calibration 2 | 1,451,464 | ||
| Calibration 3 | 1,455,852 | ||
| ssj_ops@calibrated=1,453,658 | |||
| 100% | 99.9% | 1,453,658 | 1,451,502 |
| 90% | 90.0% | 1,308,292 | 1,308,126 |
| 80% | 80.0% | 1,162,927 | 1,163,367 |
| 70% | 70.1% | 1,017,561 | 1,018,955 |
| 60% | 60.0% | 872,195 | 871,489 |
| 50% | 49.9% | 726,829 | 724,946 |
| 40% | 40.1% | 581,463 | 582,560 |
| 30% | 29.9% | 436,097 | 434,298 |
| 20% | 20.0% | 290,732 | 290,647 |
| 10% | 9.9% | 145,366 | 144,389 |
| Active Idle | 0 | 0 | |
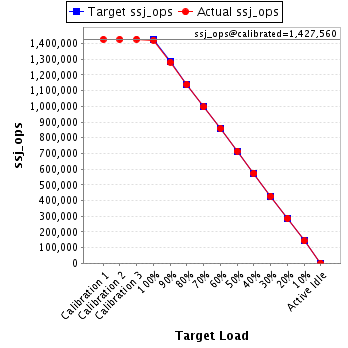
| Target Load | Actual Load | ssj_ops | |
|---|---|---|---|
| Target | Actual | ||
| Calibration 1 | 1,426,984 | ||
| Calibration 2 | 1,426,741 | ||
| Calibration 3 | 1,428,380 | ||
| ssj_ops@calibrated=1,427,560 | |||
| 100% | 99.6% | 1,427,560 | 1,422,062 |
| 90% | 89.8% | 1,284,804 | 1,281,609 |
| 80% | 79.8% | 1,142,048 | 1,139,108 |
| 70% | 69.8% | 999,292 | 996,032 |
| 60% | 60.2% | 856,536 | 859,533 |
| 50% | 50.1% | 713,780 | 714,724 |
| 40% | 40.1% | 571,024 | 572,860 |
| 30% | 30.0% | 428,268 | 427,717 |
| 20% | 20.0% | 285,512 | 285,714 |
| 10% | 10.0% | 142,756 | 142,754 |
| Active Idle | 0 | 0 | |
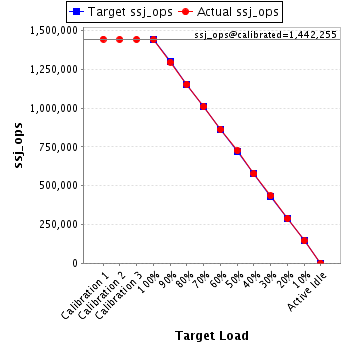
| Target Load | Actual Load | ssj_ops | |
|---|---|---|---|
| Target | Actual | ||
| Calibration 1 | 1,444,370 | ||
| Calibration 2 | 1,442,415 | ||
| Calibration 3 | 1,442,096 | ||
| ssj_ops@calibrated=1,442,255 | |||
| 100% | 99.9% | 1,442,255 | 1,441,072 |
| 90% | 89.9% | 1,298,030 | 1,296,014 |
| 80% | 80.0% | 1,153,804 | 1,153,097 |
| 70% | 70.0% | 1,009,579 | 1,009,841 |
| 60% | 59.9% | 865,353 | 863,348 |
| 50% | 50.3% | 721,128 | 725,041 |
| 40% | 40.0% | 576,902 | 576,499 |
| 30% | 30.1% | 432,677 | 433,793 |
| 20% | 20.0% | 288,451 | 288,814 |
| 10% | 10.0% | 144,226 | 144,912 |
| Active Idle | 0 | 0 | |
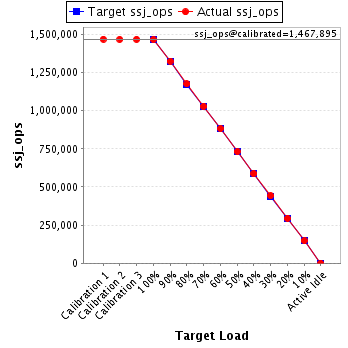
| Target Load | Actual Load | ssj_ops | |
|---|---|---|---|
| Target | Actual | ||
| Calibration 1 | 1,469,005 | ||
| Calibration 2 | 1,467,645 | ||
| Calibration 3 | 1,468,145 | ||
| ssj_ops@calibrated=1,467,895 | |||
| 100% | 99.9% | 1,467,895 | 1,466,385 |
| 90% | 90.3% | 1,321,106 | 1,325,282 |
| 80% | 80.1% | 1,174,316 | 1,175,705 |
| 70% | 70.1% | 1,027,527 | 1,029,671 |
| 60% | 60.1% | 880,737 | 882,748 |
| 50% | 49.8% | 733,948 | 731,643 |
| 40% | 40.0% | 587,158 | 586,735 |
| 30% | 30.1% | 440,369 | 442,215 |
| 20% | 20.1% | 293,579 | 294,925 |
| 10% | 10.0% | 146,790 | 147,199 |
| Active Idle | 0 | 0 | |
| Target Load | Actual Load | ssj_ops | |
|---|---|---|---|
| Target | Actual | ||
| Calibration 1 | 1,451,433 | ||
| Calibration 2 | 1,453,687 | ||
| Calibration 3 | 1,455,971 | ||
| ssj_ops@calibrated=1,454,829 | |||
| 100% | 99.7% | 1,454,829 | 1,450,387 |
| 90% | 89.9% | 1,309,346 | 1,307,923 |
| 80% | 80.0% | 1,163,863 | 1,163,976 |
| 70% | 70.2% | 1,018,380 | 1,020,717 |
| 60% | 60.0% | 872,898 | 872,740 |
| 50% | 49.9% | 727,415 | 726,300 |
| 40% | 39.9% | 581,932 | 581,139 |
| 30% | 30.1% | 436,449 | 438,483 |
| 20% | 20.0% | 290,966 | 290,466 |
| 10% | 10.0% | 145,483 | 146,098 |
| Active Idle | 0 | 0 | |

| Target Load | Actual Load | ssj_ops | |
|---|---|---|---|
| Target | Actual | ||
| Calibration 1 | 1,457,831 | ||
| Calibration 2 | 1,458,323 | ||
| Calibration 3 | 1,459,069 | ||
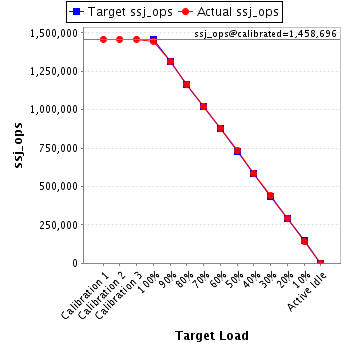
| ssj_ops@calibrated=1,458,696 | |||
| 100% | 99.2% | 1,458,696 | 1,446,896 |
| 90% | 89.9% | 1,312,826 | 1,311,921 |
| 80% | 80.0% | 1,166,957 | 1,167,066 |
| 70% | 70.0% | 1,021,087 | 1,021,263 |
| 60% | 60.1% | 875,217 | 876,607 |
| 50% | 50.2% | 729,348 | 732,025 |
| 40% | 40.0% | 583,478 | 584,132 |
| 30% | 30.1% | 437,609 | 438,503 |
| 20% | 20.1% | 291,739 | 292,520 |
| 10% | 9.8% | 145,870 | 143,663 |
| Active Idle | 0 | 0 | |
| Target Load | Actual Load | ssj_ops | |
|---|---|---|---|
| Target | Actual | ||
| Calibration 1 | 1,430,056 | ||
| Calibration 2 | 1,428,534 | ||
| Calibration 3 | 1,430,181 | ||
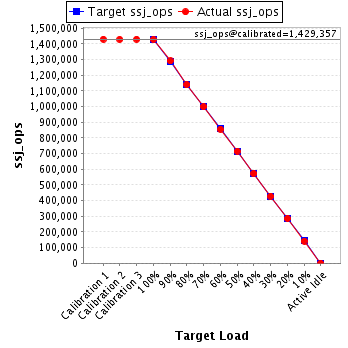
| ssj_ops@calibrated=1,429,357 | |||
| 100% | 100.0% | 1,429,357 | 1,428,645 |
| 90% | 90.3% | 1,286,422 | 1,291,063 |
| 80% | 79.8% | 1,143,486 | 1,140,139 |
| 70% | 69.9% | 1,000,550 | 999,157 |
| 60% | 59.9% | 857,614 | 856,197 |
| 50% | 50.1% | 714,679 | 715,549 |
| 40% | 40.0% | 571,743 | 571,699 |
| 30% | 30.0% | 428,807 | 428,664 |
| 20% | 20.0% | 285,871 | 285,297 |
| 10% | 9.9% | 142,936 | 141,504 |
| Active Idle | 0 | 0 | |