SPECpower_ssj2008
Host 'NODE06' Performance Report
Copyright © 2007-2018 Standard Performance Evaluation Corporation
| Hewlett Packard Enterprise Synergy 480 Gen10 Compute Module | ssj_ops@100% = 5,692,863 ssj_ops@100% per JVM = 1,423,216 |
||||
| Test Sponsor: | Hewlett Packard Enterprise | SPEC License #: | 3 | Test Method: | Multi Node |
| Tested By: | Hewlett Packard Enterprise | Test Location: | Houston, TX, USA | Test Date: | Aug 26, 2018 |
| Hardware Availability: | Jun-2018 | Software Availability: | Mar-2018 | Publication: | Sep 12, 2018 |
| System Source: | Single Supplier | System Designation: | Server | Power Provisioning: | Line-powered |
| Target Load | Actual Load | ssj_ops | |
|---|---|---|---|
| Target | Actual | ||
| Calibration 1 | 5,714,725 | ||
| Calibration 2 | 5,711,116 | ||
| Calibration 3 | 5,714,131 | ||
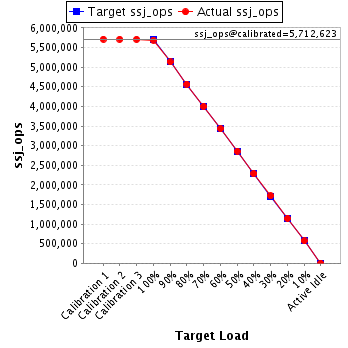
| ssj_ops@calibrated=5,712,623 | |||
| 100% | 99.7% | 5,712,623 | 5,692,863 |
| 90% | 89.9% | 5,141,361 | 5,133,372 |
| 80% | 80.0% | 4,570,099 | 4,568,110 |
| 70% | 70.1% | 3,998,836 | 4,003,911 |
| 60% | 60.1% | 3,427,574 | 3,430,841 |
| 50% | 50.1% | 2,856,312 | 2,861,094 |
| 40% | 40.0% | 2,285,049 | 2,283,824 |
| 30% | 30.0% | 1,713,787 | 1,716,601 |
| 20% | 20.0% | 1,142,525 | 1,145,201 |
| 10% | 10.0% | 571,262 | 570,770 |
| Active Idle | 0 | 0 | |
| Set Identifier: | SUT |
| Set Description: | System Under Test |
| # of Identical Nodes: | 11 |
| Comment: | SUT |
| Hardware | |
|---|---|
| Hardware Vendor: | Hewlett Packard Enterprise |
| Model: | Synergy 480 Gen10 Compute Module |
| Form Factor: | Other |
| CPU Name: | Intel Xeon Platinum 8180 2.50GHz |
| CPU Characteristics: | 28-Core, 2.50 GHz, 38.5 MB L3 Cache |
| CPU Frequency (MHz): | 2500 |
| CPU(s) Enabled: | 56 cores, 2 chips, 28 cores/chip |
| Hardware Threads: | 112 (2 / core) |
| CPU(s) Orderable: | 1,2 chips |
| Primary Cache: | 32 KB I + 32 KB D on chip per core |
| Secondary Cache: | 1 MB I+D on chip per core |
| Tertiary Cache: | 39424 KB I+D on chip per chip |
| Other Cache: | None |
| Memory Amount (GB): | 192 |
| # and size of DIMM: | 12 x 16384 MB |
| Memory Details: | 12 x 16GB 2Rx8 PC4-2666-V ECC; slots 1, 3, 5, 8, 10 and 12 populated on each CPU socket |
| Power Supply Quantity and Rating (W): | None |
| Power Supply Details: | Shared |
| Disk Drive: | 1 x HPE Synergy 480 Gen10 M.2 FIO Adapter Board Kit (873165-B21); 1 x HPE 480GB SATA 6G Read Intensive M.2 2280 SSD (875498-B21) |
| Disk Controller: | 1 x HPE Smart Array S100i SR Gen10 |
| # and type of Network Interface Cards (NICs) Installed: | 1 x HPE Synergy 3820C 10/20Gb 2-port Converged Network Adapter (777430-B21) |
| NICs Enabled in Firmware / OS / Connected: | 2/1/1 |
| Network Speed (Mbit): | 10000 |
| Keyboard: | None |
| Mouse: | None |
| Monitor: | None |
| Optical Drives: | No |
| Other Hardware: | None |
| Software | |
|---|---|
| Power Management: | Enabled (see SUT Notes) |
| Operating System (OS): | Windows Server 2012 R2 Datacenter |
| OS Version: | 6.3 (Build 9600) |
| Filesystem: | NTFS |
| JVM Vendor: | Oracle Corporation |
| JVM Version: | Java HotSpot(TM) 64-Bit Server VM (build 24.80-b11, mixed mode), version 1.7.0_80 |
| JVM Command-line Options: | -server -Xmn19g -Xms21g -Xmx21g -XX:SurvivorRatio=1 -XX:TargetSurvivorRatio=99 -XX:ParallelGCThreads=28 -XX:AllocatePrefetchDistance=256 -XX:AllocatePrefetchLines=4 -XX:LoopUnrollLimit=45 -XX:InitialTenuringThreshold=12 -XX:MaxTenuringThreshold=15 -XX:InlineSmallCode=9000 -XX:MaxInlineSize=270 -XX:FreqInlineSize=6000 -XX:+UseLargePages -XX:+UseParallelOldGC -XX:+AggressiveOpts |
| JVM Affinity: | start /NODE [0,1,2,3] /AFFINITY [0xFFFFFFF] |
| JVM Instances: | 4 |
| JVM Initial Heap (MB): | 21000 |
| JVM Maximum Heap (MB): | 21000 |
| JVM Address Bits: | 64 |
| Boot Firmware Version: | I42 v1.32 (02/01/2018) |
| Management Firmware Version: | 1.15 Aug 17 2017 |
| Workload Version: | SSJ 1.2.10 |
| Director Location: | Controller |
| Other Software: | HPE Composer Version 3.10.07 (HPE OneView) with HPE Synergy Custom SPP Bundle 2017.10.20180323; Microsoft Windows KB4054519, KB4056898 |
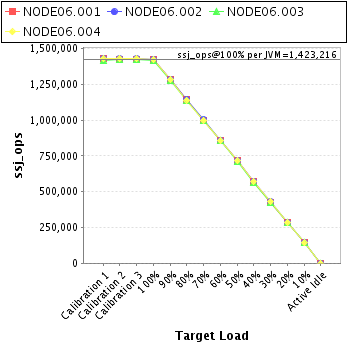
| JVM Instance | ssj_ops@100% |
|---|---|
| NODE06.001 | 1,423,708 |
| NODE06.002 | 1,427,019 |
| NODE06.003 | 1,418,169 |
| NODE06.004 | 1,423,968 |
| ssj_ops@100% | 5,692,863 |
| ssj_ops@100% per JVM | 1,423,216 |
| Target Load | Actual Load | ssj_ops | |
|---|---|---|---|
| Target | Actual | ||
| Calibration 1 | 1,433,863 | ||
| Calibration 2 | 1,427,925 | ||
| Calibration 3 | 1,427,482 | ||
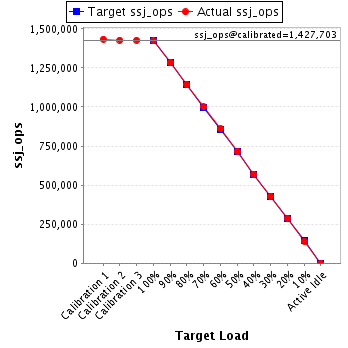
| ssj_ops@calibrated=1,427,703 | |||
| 100% | 99.7% | 1,427,703 | 1,423,708 |
| 90% | 89.9% | 1,284,933 | 1,283,006 |
| 80% | 80.1% | 1,142,163 | 1,143,993 |
| 70% | 70.1% | 999,392 | 1,000,201 |
| 60% | 60.2% | 856,622 | 859,725 |
| 50% | 50.2% | 713,852 | 716,467 |
| 40% | 40.0% | 571,081 | 570,607 |
| 30% | 30.0% | 428,311 | 427,850 |
| 20% | 20.2% | 285,541 | 288,101 |
| 10% | 10.0% | 142,770 | 142,194 |
| Active Idle | 0 | 0 | |
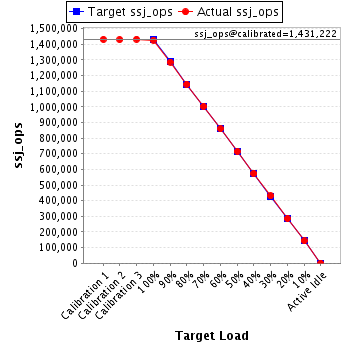
| Target Load | Actual Load | ssj_ops | |
|---|---|---|---|
| Target | Actual | ||
| Calibration 1 | 1,431,679 | ||
| Calibration 2 | 1,429,745 | ||
| Calibration 3 | 1,432,699 | ||
| ssj_ops@calibrated=1,431,222 | |||
| 100% | 99.7% | 1,431,222 | 1,427,019 |
| 90% | 89.9% | 1,288,100 | 1,286,571 |
| 80% | 80.0% | 1,144,978 | 1,144,736 |
| 70% | 70.2% | 1,001,855 | 1,004,040 |
| 60% | 60.0% | 858,733 | 858,887 |
| 50% | 50.0% | 715,611 | 715,653 |
| 40% | 40.0% | 572,489 | 573,037 |
| 30% | 30.1% | 429,367 | 430,155 |
| 20% | 19.9% | 286,244 | 285,239 |
| 10% | 10.0% | 143,122 | 143,265 |
| Active Idle | 0 | 0 | |
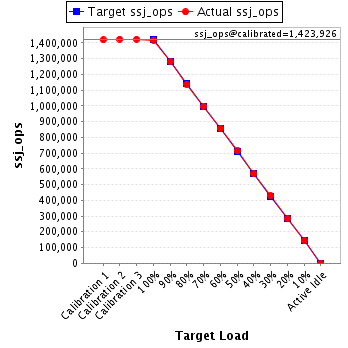
| Target Load | Actual Load | ssj_ops | |
|---|---|---|---|
| Target | Actual | ||
| Calibration 1 | 1,419,640 | ||
| Calibration 2 | 1,423,992 | ||
| Calibration 3 | 1,423,861 | ||
| ssj_ops@calibrated=1,423,926 | |||
| 100% | 99.6% | 1,423,926 | 1,418,169 |
| 90% | 90.0% | 1,281,534 | 1,281,169 |
| 80% | 79.9% | 1,139,141 | 1,138,329 |
| 70% | 70.1% | 996,748 | 998,593 |
| 60% | 60.1% | 854,356 | 856,144 |
| 50% | 50.1% | 711,963 | 713,468 |
| 40% | 39.9% | 569,571 | 567,972 |
| 30% | 30.0% | 427,178 | 427,747 |
| 20% | 20.0% | 284,785 | 284,486 |
| 10% | 10.0% | 142,393 | 142,991 |
| Active Idle | 0 | 0 | |
| Target Load | Actual Load | ssj_ops | |
|---|---|---|---|
| Target | Actual | ||
| Calibration 1 | 1,429,543 | ||
| Calibration 2 | 1,429,454 | ||
| Calibration 3 | 1,430,089 | ||
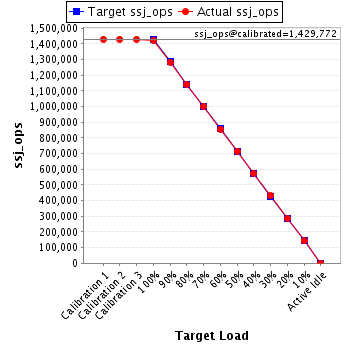
| ssj_ops@calibrated=1,429,772 | |||
| 100% | 99.6% | 1,429,772 | 1,423,968 |
| 90% | 89.7% | 1,286,794 | 1,282,625 |
| 80% | 79.8% | 1,143,817 | 1,141,052 |
| 70% | 70.0% | 1,000,840 | 1,001,077 |
| 60% | 59.9% | 857,863 | 856,084 |
| 50% | 50.0% | 714,886 | 715,507 |
| 40% | 40.0% | 571,909 | 572,208 |
| 30% | 30.1% | 428,931 | 430,850 |
| 20% | 20.1% | 285,954 | 287,376 |
| 10% | 10.0% | 142,977 | 142,321 |
| Active Idle | 0 | 0 | |