SPECpower_ssj2008
Host 'ML350-SUT04' Performance Report
Copyright © 2007-2017 Standard Performance Evaluation Corporation
| Hewlett Packard Enterprise ProLiant ML350 Gen10 | ssj_ops@100% = 5,800,646 ssj_ops@100% per JVM = 1,450,162 |
||||
| Test Sponsor: | Hewlett Packard Enterprise | SPEC License #: | 3 | Test Method: | Single Node |
| Tested By: | Hewlett Packard Enterprise | Test Location: | Houston, TX, USA | Test Date: | Oct 6, 2017 |
| Hardware Availability: | Oct-2017 | Software Availability: | Jan-2015 | Publication: | Oct 25, 2017 |
| System Source: | Single Supplier | System Designation: | Server | Power Provisioning: | Line-powered |
| Target Load | Actual Load | ssj_ops | |
|---|---|---|---|
| Target | Actual | ||
| Calibration 1 | 5,812,982 | ||
| Calibration 2 | 5,813,737 | ||
| Calibration 3 | 5,820,612 | ||
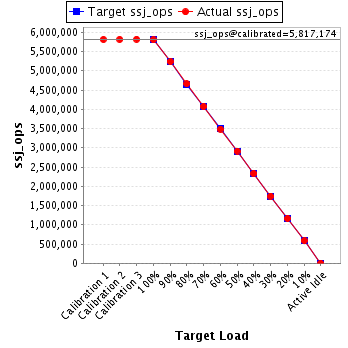
| ssj_ops@calibrated=5,817,174 | |||
| 100% | 99.7% | 5,817,174 | 5,800,646 |
| 90% | 90.1% | 5,235,457 | 5,238,825 |
| 80% | 80.2% | 4,653,740 | 4,662,988 |
| 70% | 70.1% | 4,072,022 | 4,075,249 |
| 60% | 59.9% | 3,490,305 | 3,487,278 |
| 50% | 50.1% | 2,908,587 | 2,915,712 |
| 40% | 40.0% | 2,326,870 | 2,327,735 |
| 30% | 30.0% | 1,745,152 | 1,745,784 |
| 20% | 20.0% | 1,163,435 | 1,163,044 |
| 10% | 10.0% | 581,717 | 583,190 |
| Active Idle | 0 | 0 | |
| Set Identifier: | SUT |
| Set Description: | System Under Test |
| # of Identical Nodes: | 1 |
| Comment: | SUT |
| Hardware | |
|---|---|
| Hardware Vendor: | Hewlett Packard Enterprise |
| Model: | ProLiant ML350 Gen10 |
| Form Factor: | Tower |
| CPU Name: | Intel Xeon Platinum 8180 2.50GHz |
| CPU Characteristics: | 28-Core, 2.50 GHz, 38.5MB L3 Cache |
| CPU Frequency (MHz): | 2500 |
| CPU(s) Enabled: | 56 cores, 2 chips, 28 cores/chip |
| Hardware Threads: | 112 (2 / core) |
| CPU(s) Orderable: | 1,2 chip |
| Primary Cache: | 32 KB I + 32 KB D on chip per core |
| Secondary Cache: | 1 MB I+D on chip per core |
| Tertiary Cache: | 39424 KB I+D on chip per chip |
| Other Cache: | None |
| Memory Amount (GB): | 192 |
| # and size of DIMM: | 12 x 16384 MB |
| Memory Details: | 12 x 16GB 2Rx8 PC4-2666V-REB-11; slots 1, 3, 5, 8, 10, and 12, populated in each socket |
| Power Supply Quantity and Rating (W): | 1 x 800 |
| Power Supply Details: | DPS-800AB (865438-B21) 96% |
| Disk Drive: | 1 x HPE 240GB 6G SATA M.2 SSD (875488-B21) |
| Disk Controller: | 1 x HPE Embedded 14-port S100i SATA |
| # and type of Network Interface Cards (NICs) Installed: | 1 x HPE Ethernet 1Gb 4-port 369i Adapter |
| NICs Enabled in Firmware / OS / Connected: | 4/1/1 |
| Network Speed (Mbit): | 1000 |
| Keyboard: | None |
| Mouse: | None |
| Monitor: | None |
| Optical Drives: | No |
| Other Hardware: | 1 x Optional redundant fans cage kit (874572-B21); 1 x HPE Universal SATA HHHL M.2 Kit (8788783-B21) |
| Software | |
|---|---|
| Power Management: | Enabled (see SUT Notes) |
| Operating System (OS): | Windows Server 2012 R2 Datacenter |
| OS Version: | Version 6.3 (Build 9600) |
| Filesystem: | NTFS |
| JVM Vendor: | Oracle Corporation |
| JVM Version: | Oracle Java HotSpot(TM) 64-Bit Server VM (build 24.80-b11, mixed mode), version 1.7.0_80 |
| JVM Command-line Options: | -server -Xmn23000m -Xms26000m -Xmx26000m -XX:SurvivorRatio=1 -XX:TargetSurvivorRatio=99 -XX:ParallelGCThreads=28 -XX:AllocatePrefetchDistance=256 -XX:AllocatePrefetchLines=4 -XX:LoopUnrollLimit=45 -XX:InitialTenuringThreshold=12 -XX:MaxTenuringThreshold=15 -XX:InlineSmallCode=3900 -XX:MaxInlineSize=270 -XX:FreqInlineSize=2500 -XX:+AggressiveOpts -XX:+UseLargePages -XX:+UseParallelOldGC |
| JVM Affinity: | start /NODE [0,1,2,3] /AFFINITY [0xFFFFFFF] |
| JVM Instances: | 4 |
| JVM Initial Heap (MB): | 26000 |
| JVM Maximum Heap (MB): | 26000 |
| JVM Address Bits: | 64 |
| Boot Firmware Version: | U41 v1.22 (09/29/2017) |
| Management Firmware Version: | 1.15 Aug 03 2017 |
| Workload Version: | SSJ 1.2.10 |
| Director Location: | Controller |
| Other Software: | None |
| JVM Instance | ssj_ops@100% |
|---|---|
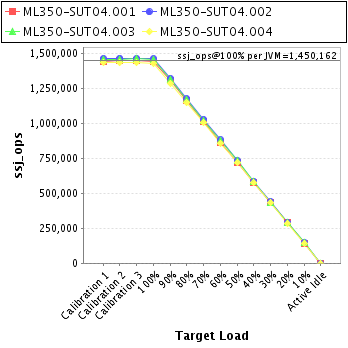
| ML350-SUT04.001 | 1,445,551 |
| ML350-SUT04.002 | 1,464,122 |
| ML350-SUT04.003 | 1,457,902 |
| ML350-SUT04.004 | 1,433,071 |
| ssj_ops@100% | 5,800,646 |
| ssj_ops@100% per JVM | 1,450,162 |
| Target Load | Actual Load | ssj_ops | |
|---|---|---|---|
| Target | Actual | ||
| Calibration 1 | 1,447,641 | ||
| Calibration 2 | 1,448,715 | ||
| Calibration 3 | 1,450,088 | ||
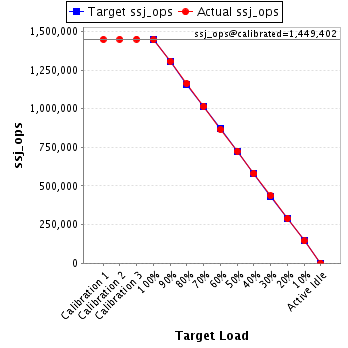
| ssj_ops@calibrated=1,449,402 | |||
| 100% | 99.7% | 1,449,402 | 1,445,551 |
| 90% | 90.2% | 1,304,462 | 1,307,413 |
| 80% | 80.3% | 1,159,521 | 1,163,325 |
| 70% | 70.1% | 1,014,581 | 1,015,678 |
| 60% | 59.7% | 869,641 | 865,781 |
| 50% | 50.0% | 724,701 | 724,872 |
| 40% | 40.0% | 579,761 | 579,800 |
| 30% | 30.1% | 434,821 | 435,671 |
| 20% | 19.9% | 289,880 | 289,155 |
| 10% | 10.0% | 144,940 | 144,667 |
| Active Idle | 0 | 0 | |
| Target Load | Actual Load | ssj_ops | |
|---|---|---|---|
| Target | Actual | ||
| Calibration 1 | 1,465,754 | ||
| Calibration 2 | 1,468,447 | ||
| Calibration 3 | 1,468,183 | ||
| ssj_ops@calibrated=1,468,315 | |||
| 100% | 99.7% | 1,468,315 | 1,464,122 |
| 90% | 90.2% | 1,321,484 | 1,324,031 |
| 80% | 80.2% | 1,174,652 | 1,177,370 |
| 70% | 70.1% | 1,027,821 | 1,029,951 |
| 60% | 60.1% | 880,989 | 882,847 |
| 50% | 50.2% | 734,158 | 736,505 |
| 40% | 40.1% | 587,326 | 588,262 |
| 30% | 30.0% | 440,495 | 440,918 |
| 20% | 19.9% | 293,663 | 292,471 |
| 10% | 10.1% | 146,832 | 147,661 |
| Active Idle | 0 | 0 | |

| Target Load | Actual Load | ssj_ops | |
|---|---|---|---|
| Target | Actual | ||
| Calibration 1 | 1,461,664 | ||
| Calibration 2 | 1,461,272 | ||
| Calibration 3 | 1,464,048 | ||
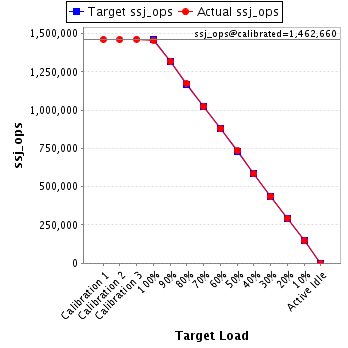
| ssj_ops@calibrated=1,462,660 | |||
| 100% | 99.7% | 1,462,660 | 1,457,902 |
| 90% | 90.1% | 1,316,394 | 1,317,138 |
| 80% | 80.2% | 1,170,128 | 1,173,008 |
| 70% | 70.0% | 1,023,862 | 1,024,221 |
| 60% | 60.0% | 877,596 | 878,285 |
| 50% | 50.2% | 731,330 | 733,672 |
| 40% | 40.0% | 585,064 | 584,374 |
| 30% | 29.9% | 438,798 | 437,296 |
| 20% | 20.0% | 292,532 | 293,225 |
| 10% | 10.1% | 146,266 | 147,025 |
| Active Idle | 0 | 0 | |
| Target Load | Actual Load | ssj_ops | |
|---|---|---|---|
| Target | Actual | ||
| Calibration 1 | 1,437,923 | ||
| Calibration 2 | 1,435,302 | ||
| Calibration 3 | 1,438,293 | ||
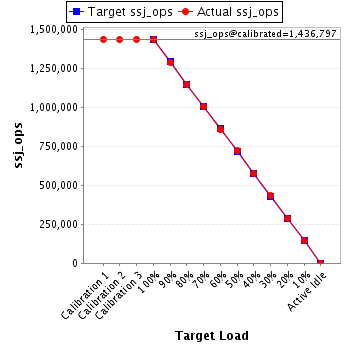
| ssj_ops@calibrated=1,436,797 | |||
| 100% | 99.7% | 1,436,797 | 1,433,071 |
| 90% | 89.8% | 1,293,118 | 1,290,243 |
| 80% | 80.0% | 1,149,438 | 1,149,285 |
| 70% | 70.0% | 1,005,758 | 1,005,399 |
| 60% | 59.9% | 862,078 | 860,365 |
| 50% | 50.2% | 718,399 | 720,662 |
| 40% | 40.0% | 574,719 | 575,299 |
| 30% | 30.1% | 431,039 | 431,898 |
| 20% | 20.1% | 287,359 | 288,193 |
| 10% | 10.0% | 143,680 | 143,837 |
| Active Idle | 0 | 0 | |