SPECpower_ssj2008
Host 'M620-12' Performance Report
Copyright © 2007-2013 Standard Performance Evaluation Corporation
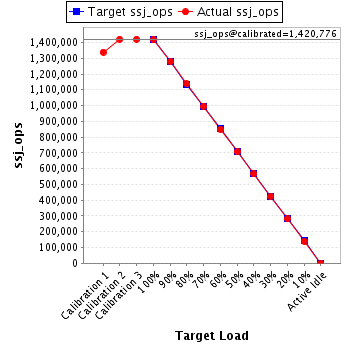
| Dell Inc. PowerEdge M620 (Intel Xeon E5-2670, 2.60 GHz) | ssj_ops@100% = 1,417,933 ssj_ops@100% per JVM = 88,621 |
||||
| Test Sponsor: | Dell Inc. | SPEC License #: | 55 | Test Method: | Multi Node |
| Tested By: | Dell Inc. | Test Location: | Round Rock, TX, USA | Test Date: | Jan 11, 2013 |
| Hardware Availability: | Dec-2012 | Software Availability: | Jun-2012 | Publication: | Feb 20, 2013 |
| System Source: | Single Supplier | System Designation: | Server | Power Provisioning: | Line-powered |
| Target Load | Actual Load | ssj_ops | |
|---|---|---|---|
| Target | Actual | ||
| Calibration 1 | 1,338,674 | ||
| Calibration 2 | 1,420,517 | ||
| Calibration 3 | 1,421,035 | ||
| ssj_ops@calibrated=1,420,776 | |||
| 100% | 99.8% | 1,420,776 | 1,417,933 |
| 90% | 90.0% | 1,278,698 | 1,278,569 |
| 80% | 80.1% | 1,136,620 | 1,137,346 |
| 70% | 70.1% | 994,543 | 995,600 |
| 60% | 59.9% | 852,465 | 850,965 |
| 50% | 49.9% | 710,388 | 708,297 |
| 40% | 39.9% | 568,310 | 566,286 |
| 30% | 30.0% | 426,233 | 426,193 |
| 20% | 19.8% | 284,155 | 281,552 |
| 10% | 9.9% | 142,078 | 140,759 |
| Active Idle | 0 | 0 | |
| Set Identifier: | sut |
| Set Description: | M620 |
| # of Identical Nodes: | 16 |
| Comment: | None |
| Hardware | |
|---|---|
| Hardware Vendor: | Dell Inc. |
| Model: | PowerEdge M620 (Intel Xeon E5-2670, 2.60 GHz) |
| Form Factor: | Blade |
| CPU Name: | Intel Xeon E5-2670 2.60 GHz |
| CPU Characteristics: | 8 Core, 2.60 GHz, 20MB L3 Cache |
| CPU Frequency (MHz): | 2600 |
| CPU(s) Enabled: | 16 cores, 2 chips, 8 cores/chip |
| Hardware Threads: | 32 (2 / core) |
| CPU(s) Orderable: | 1,2 chips |
| Primary Cache: | 32 KB I + 32 KB D on chip per core |
| Secondary Cache: | 256 KB I+D on chip per chip |
| Tertiary Cache: | 20 MB I+D on chip per chip |
| Other Cache: | None |
| Memory Amount (GB): | 24 |
| # and size of DIMM: | 6 x 4096 MB |
| Memory Details: | 4GB 2Rx8 PC3L-10600E-9 ECC, Slots A1-3, B1-3 populated |
| Power Supply Quantity and Rating (W): | None |
| Power Supply Details: | Shared |
| Disk Drive: | 1 x 100 GB 2.5" SATA SSD, Dell P/N: DYW42 |
| Disk Controller: | Integrated PERC S110 |
| # and type of Network Interface Cards (NICs) Installed: | 1 x Onboard Dual-Port Intel X520-k Gigabit Ethernet |
| NICs Enabled in Firmware / OS / Connected: | 2/2/1 |
| Network Speed (Mbit): | 1000 |
| Keyboard: | None |
| Mouse: | None |
| Monitor: | None |
| Optical Drives: | No |
| Other Hardware: | None |
| Software | |
|---|---|
| Power Management: | Power Saver Mode in OS (See Notes) |
| Operating System (OS): | Microsoft Windows Server 2008 Enterprise x64 Edition |
| OS Version: | R2 SP1 |
| Filesystem: | NTFS |
| JVM Vendor: | IBM Corporation |
| JVM Version: | IBM J9 VM (build 2.6, JRE 1.7.0 Windows Server 2008 R2 amd64-64 20120322_106209 (JIT enabled, AOT enabled) |
| JVM Command-line Options: | -Xaggressive -Xcompressedrefs -Xmn800m -Xms1024m -Xmx1024m -XlockReservation -Xnoloa -Xlp -Xconcurrentlevel0 -XtlhPrefetch -Xthr:minimizeusercpu -Xgcthreads4 |
| JVM Affinity: | start /affinity [3, C, 30, C0, 300, C00, 3000, C000, 30000, C0000, 300000, C00000, 3000000, C0000000, 30000000, C0000000] |
| JVM Instances: | 16 |
| JVM Initial Heap (MB): | 1024 |
| JVM Maximum Heap (MB): | 1024 |
| JVM Address Bits: | 64 |
| Boot Firmware Version: | 1.4.9 |
| Management Firmware Version: | iDRAC7 1.30.30 (Build 39) |
| Workload Version: | SSJ 1.2.10 |
| Director Location: | Controller |
| Other Software: | IBM SDK Java Technology Edition Version 7.0 for Windows x64 |
| JVM Instance | ssj_ops@100% |
|---|---|
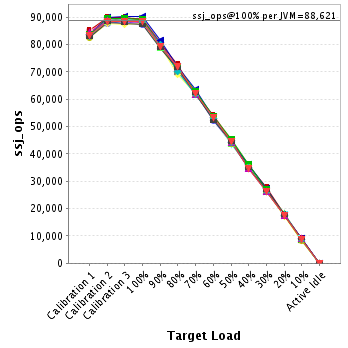
| M620-12.001 | 89,164 |
| M620-12.002 | 87,331 |
| M620-12.003 | 88,057 |
| M620-12.004 | 87,600 |
| M620-12.005 | 88,377 |
| M620-12.006 | 88,704 |
| M620-12.007 | 89,560 |
| M620-12.008 | 89,406 |
| M620-12.009 | 89,215 |
| M620-12.010 | 90,290 |
| M620-12.011 | 89,254 |
| M620-12.012 | 88,565 |
| M620-12.013 | 88,166 |
| M620-12.014 | 88,529 |
| M620-12.015 | 87,284 |
| M620-12.016 | 88,429 |
| ssj_ops@100% | 1,417,933 |
| ssj_ops@100% per JVM | 88,621 |
| Target Load | Actual Load | ssj_ops | |
|---|---|---|---|
| Target | Actual | ||
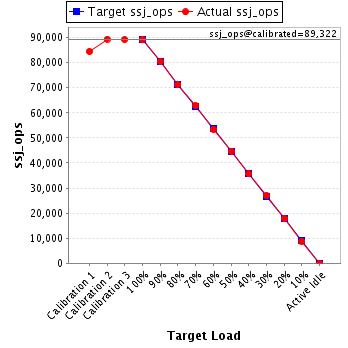
| Calibration 1 | 84,455 | ||
| Calibration 2 | 89,375 | ||
| Calibration 3 | 89,268 | ||
| ssj_ops@calibrated=89,322 | |||
| 100% | 99.8% | 89,322 | 89,164 |
| 90% | 90.1% | 80,389 | 80,434 |
| 80% | 79.7% | 71,457 | 71,203 |
| 70% | 70.3% | 62,525 | 62,815 |
| 60% | 59.8% | 53,593 | 53,377 |
| 50% | 50.1% | 44,661 | 44,725 |
| 40% | 39.9% | 35,729 | 35,602 |
| 30% | 30.2% | 26,796 | 27,017 |
| 20% | 19.9% | 17,864 | 17,800 |
| 10% | 9.7% | 8,932 | 8,658 |
| Active Idle | 0 | 0 | |
| Target Load | Actual Load | ssj_ops | |
|---|---|---|---|
| Target | Actual | ||
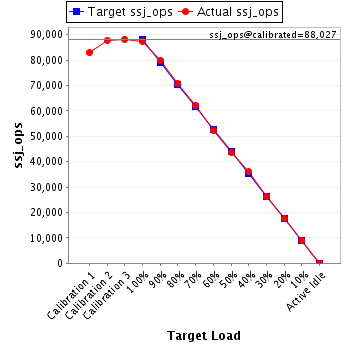
| Calibration 1 | 82,889 | ||
| Calibration 2 | 87,801 | ||
| Calibration 3 | 88,253 | ||
| ssj_ops@calibrated=88,027 | |||
| 100% | 99.2% | 88,027 | 87,331 |
| 90% | 90.7% | 79,224 | 79,798 |
| 80% | 80.4% | 70,422 | 70,810 |
| 70% | 70.6% | 61,619 | 62,152 |
| 60% | 59.5% | 52,816 | 52,383 |
| 50% | 49.6% | 44,014 | 43,637 |
| 40% | 40.8% | 35,211 | 35,954 |
| 30% | 29.8% | 26,408 | 26,208 |
| 20% | 19.9% | 17,605 | 17,504 |
| 10% | 10.2% | 8,803 | 8,970 |
| Active Idle | 0 | 0 | |
| Target Load | Actual Load | ssj_ops | |
|---|---|---|---|
| Target | Actual | ||
| Calibration 1 | 83,772 | ||
| Calibration 2 | 88,530 | ||
| Calibration 3 | 88,631 | ||
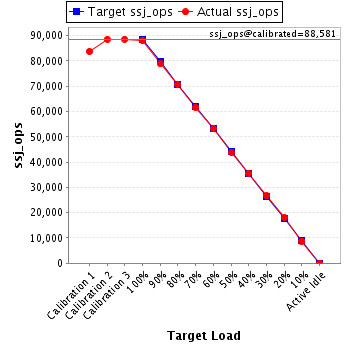
| ssj_ops@calibrated=88,581 | |||
| 100% | 99.4% | 88,581 | 88,057 |
| 90% | 89.0% | 79,723 | 78,825 |
| 80% | 79.9% | 70,865 | 70,774 |
| 70% | 69.8% | 62,007 | 61,799 |
| 60% | 60.0% | 53,149 | 53,150 |
| 50% | 49.4% | 44,290 | 43,745 |
| 40% | 40.2% | 35,432 | 35,630 |
| 30% | 30.1% | 26,574 | 26,675 |
| 20% | 20.3% | 17,716 | 18,017 |
| 10% | 9.9% | 8,858 | 8,795 |
| Active Idle | 0 | 0 | |
| Target Load | Actual Load | ssj_ops | |
|---|---|---|---|
| Target | Actual | ||
| Calibration 1 | 82,543 | ||
| Calibration 2 | 87,777 | ||
| Calibration 3 | 87,452 | ||
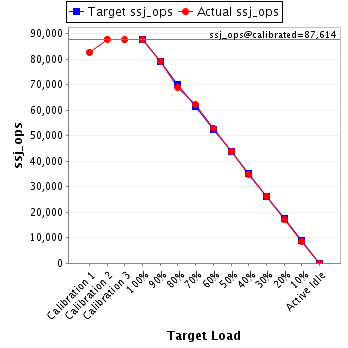
| ssj_ops@calibrated=87,614 | |||
| 100% | 100.0% | 87,614 | 87,600 |
| 90% | 90.4% | 78,853 | 79,166 |
| 80% | 78.7% | 70,092 | 68,964 |
| 70% | 70.9% | 61,330 | 62,129 |
| 60% | 60.4% | 52,569 | 52,921 |
| 50% | 50.1% | 43,807 | 43,894 |
| 40% | 39.9% | 35,046 | 34,930 |
| 30% | 30.0% | 26,284 | 26,242 |
| 20% | 19.4% | 17,523 | 17,037 |
| 10% | 9.7% | 8,761 | 8,491 |
| Active Idle | 0 | 0 | |
| Target Load | Actual Load | ssj_ops | |
|---|---|---|---|
| Target | Actual | ||
| Calibration 1 | 84,458 | ||
| Calibration 2 | 88,640 | ||
| Calibration 3 | 88,455 | ||
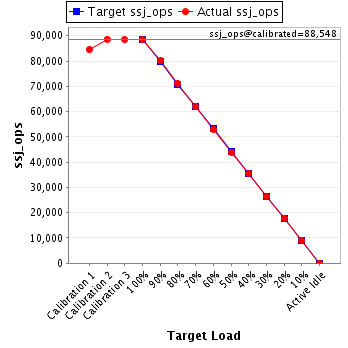
| ssj_ops@calibrated=88,548 | |||
| 100% | 99.8% | 88,548 | 88,377 |
| 90% | 90.4% | 79,693 | 80,050 |
| 80% | 80.4% | 70,838 | 71,205 |
| 70% | 69.9% | 61,983 | 61,859 |
| 60% | 59.9% | 53,129 | 53,065 |
| 50% | 49.6% | 44,274 | 43,934 |
| 40% | 40.3% | 35,419 | 35,647 |
| 30% | 29.8% | 26,564 | 26,421 |
| 20% | 20.1% | 17,710 | 17,765 |
| 10% | 10.2% | 8,855 | 9,032 |
| Active Idle | 0 | 0 | |
| Target Load | Actual Load | ssj_ops | |
|---|---|---|---|
| Target | Actual | ||
| Calibration 1 | 83,138 | ||
| Calibration 2 | 89,031 | ||
| Calibration 3 | 89,013 | ||
| ssj_ops@calibrated=89,022 | |||
| 100% | 99.6% | 89,022 | 88,704 |
| 90% | 90.8% | 80,120 | 80,861 |
| 80% | 80.7% | 71,217 | 71,809 |
| 70% | 69.6% | 62,315 | 61,928 |
| 60% | 60.3% | 53,413 | 53,655 |
| 50% | 48.9% | 44,511 | 43,497 |
| 40% | 39.8% | 35,609 | 35,388 |
| 30% | 30.0% | 26,707 | 26,729 |
| 20% | 20.0% | 17,804 | 17,817 |
| 10% | 10.3% | 8,902 | 9,129 |
| Active Idle | 0 | 0 | |

| Target Load | Actual Load | ssj_ops | |
|---|---|---|---|
| Target | Actual | ||
| Calibration 1 | 85,376 | ||
| Calibration 2 | 89,244 | ||
| Calibration 3 | 89,533 | ||
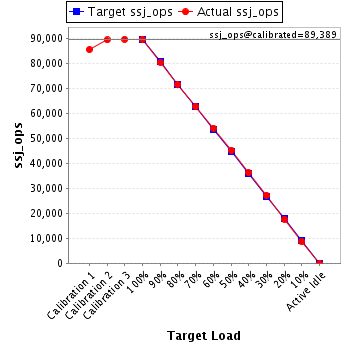
| ssj_ops@calibrated=89,389 | |||
| 100% | 100.2% | 89,389 | 89,560 |
| 90% | 89.8% | 80,450 | 80,262 |
| 80% | 79.9% | 71,511 | 71,424 |
| 70% | 70.1% | 62,572 | 62,618 |
| 60% | 60.4% | 53,633 | 54,006 |
| 50% | 50.5% | 44,694 | 45,135 |
| 40% | 40.4% | 35,755 | 36,108 |
| 30% | 30.4% | 26,817 | 27,192 |
| 20% | 19.7% | 17,878 | 17,621 |
| 10% | 9.7% | 8,939 | 8,645 |
| Active Idle | 0 | 0 | |
| Target Load | Actual Load | ssj_ops | |
|---|---|---|---|
| Target | Actual | ||
| Calibration 1 | 83,664 | ||
| Calibration 2 | 88,807 | ||
| Calibration 3 | 89,428 | ||
| ssj_ops@calibrated=89,117 | |||
| 100% | 100.3% | 89,117 | 89,406 |
| 90% | 90.7% | 80,205 | 80,853 |
| 80% | 78.6% | 71,294 | 70,009 |
| 70% | 70.4% | 62,382 | 62,738 |
| 60% | 59.5% | 53,470 | 53,048 |
| 50% | 50.5% | 44,559 | 44,965 |
| 40% | 39.4% | 35,647 | 35,155 |
| 30% | 29.3% | 26,735 | 26,088 |
| 20% | 19.5% | 17,823 | 17,340 |
| 10% | 9.9% | 8,912 | 8,837 |
| Active Idle | 0 | 0 | |

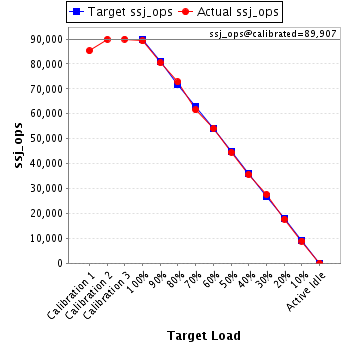
| Target Load | Actual Load | ssj_ops | |
|---|---|---|---|
| Target | Actual | ||
| Calibration 1 | 85,273 | ||
| Calibration 2 | 89,865 | ||
| Calibration 3 | 89,948 | ||
| ssj_ops@calibrated=89,907 | |||
| 100% | 99.2% | 89,907 | 89,215 |
| 90% | 89.5% | 80,916 | 80,491 |
| 80% | 80.9% | 71,925 | 72,767 |
| 70% | 68.4% | 62,935 | 61,539 |
| 60% | 60.1% | 53,944 | 54,072 |
| 50% | 49.5% | 44,953 | 44,532 |
| 40% | 39.6% | 35,963 | 35,597 |
| 30% | 30.6% | 26,972 | 27,544 |
| 20% | 19.7% | 17,981 | 17,703 |
| 10% | 9.9% | 8,991 | 8,925 |
| Active Idle | 0 | 0 | |
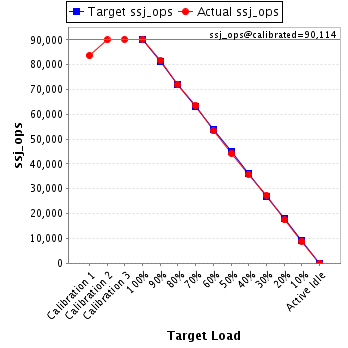
| Target Load | Actual Load | ssj_ops | |
|---|---|---|---|
| Target | Actual | ||
| Calibration 1 | 83,729 | ||
| Calibration 2 | 90,011 | ||
| Calibration 3 | 90,216 | ||
| ssj_ops@calibrated=90,114 | |||
| 100% | 100.2% | 90,114 | 90,290 |
| 90% | 90.6% | 81,102 | 81,624 |
| 80% | 80.0% | 72,091 | 72,071 |
| 70% | 70.5% | 63,080 | 63,505 |
| 60% | 59.2% | 54,068 | 53,313 |
| 50% | 49.1% | 45,057 | 44,252 |
| 40% | 39.9% | 36,045 | 35,962 |
| 30% | 30.2% | 27,034 | 27,200 |
| 20% | 19.5% | 18,023 | 17,546 |
| 10% | 9.9% | 9,011 | 8,899 |
| Active Idle | 0 | 0 | |
| Target Load | Actual Load | ssj_ops | |
|---|---|---|---|
| Target | Actual | ||
| Calibration 1 | 83,494 | ||
| Calibration 2 | 89,334 | ||
| Calibration 3 | 89,584 | ||
| ssj_ops@calibrated=89,459 | |||
| 100% | 99.8% | 89,459 | 89,254 |
| 90% | 88.7% | 80,513 | 79,343 |
| 80% | 80.0% | 71,567 | 71,587 |
| 70% | 70.2% | 62,621 | 62,838 |
| 60% | 59.8% | 53,675 | 53,531 |
| 50% | 50.4% | 44,730 | 45,108 |
| 40% | 40.2% | 35,784 | 35,993 |
| 30% | 30.3% | 26,838 | 27,083 |
| 20% | 19.6% | 17,892 | 17,519 |
| 10% | 9.6% | 8,946 | 8,620 |
| Active Idle | 0 | 0 | |

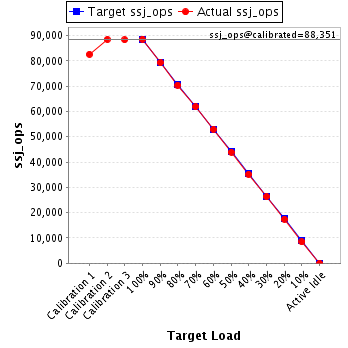
| Target Load | Actual Load | ssj_ops | |
|---|---|---|---|
| Target | Actual | ||
| Calibration 1 | 82,583 | ||
| Calibration 2 | 88,411 | ||
| Calibration 3 | 88,291 | ||
| ssj_ops@calibrated=88,351 | |||
| 100% | 100.2% | 88,351 | 88,565 |
| 90% | 89.8% | 79,516 | 79,318 |
| 80% | 79.7% | 70,681 | 70,383 |
| 70% | 70.0% | 61,845 | 61,844 |
| 60% | 59.9% | 53,010 | 52,957 |
| 50% | 49.7% | 44,175 | 43,916 |
| 40% | 39.8% | 35,340 | 35,179 |
| 30% | 29.8% | 26,505 | 26,329 |
| 20% | 19.7% | 17,670 | 17,435 |
| 10% | 9.6% | 8,835 | 8,467 |
| Active Idle | 0 | 0 | |
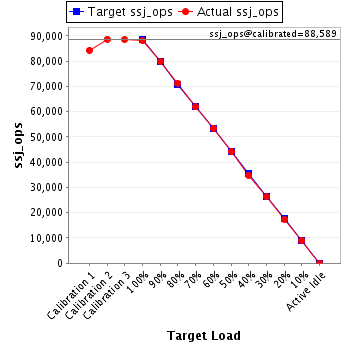
| Target Load | Actual Load | ssj_ops | |
|---|---|---|---|
| Target | Actual | ||
| Calibration 1 | 84,255 | ||
| Calibration 2 | 88,680 | ||
| Calibration 3 | 88,499 | ||
| ssj_ops@calibrated=88,589 | |||
| 100% | 99.5% | 88,589 | 88,166 |
| 90% | 90.0% | 79,730 | 79,771 |
| 80% | 80.5% | 70,872 | 71,302 |
| 70% | 69.8% | 62,013 | 61,845 |
| 60% | 60.2% | 53,154 | 53,327 |
| 50% | 49.7% | 44,295 | 44,058 |
| 40% | 39.3% | 35,436 | 34,834 |
| 30% | 29.6% | 26,577 | 26,225 |
| 20% | 19.7% | 17,718 | 17,433 |
| 10% | 10.1% | 8,859 | 8,954 |
| Active Idle | 0 | 0 | |
| Target Load | Actual Load | ssj_ops | |
|---|---|---|---|
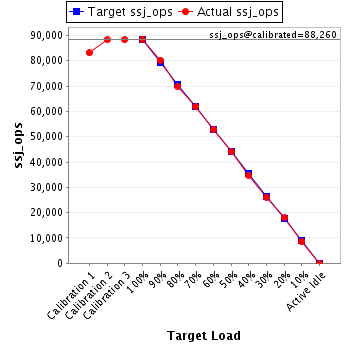
| Target | Actual | ||
| Calibration 1 | 83,074 | ||
| Calibration 2 | 88,267 | ||
| Calibration 3 | 88,253 | ||
| ssj_ops@calibrated=88,260 | |||
| 100% | 100.3% | 88,260 | 88,529 |
| 90% | 90.8% | 79,434 | 80,144 |
| 80% | 79.3% | 70,608 | 69,953 |
| 70% | 70.0% | 61,782 | 61,825 |
| 60% | 59.8% | 52,956 | 52,786 |
| 50% | 49.9% | 44,130 | 44,050 |
| 40% | 39.5% | 35,304 | 34,864 |
| 30% | 29.6% | 26,478 | 26,149 |
| 20% | 20.3% | 17,652 | 17,902 |
| 10% | 9.7% | 8,826 | 8,529 |
| Active Idle | 0 | 0 | |
| Target Load | Actual Load | ssj_ops | |
|---|---|---|---|
| Target | Actual | ||
| Calibration 1 | 82,629 | ||
| Calibration 2 | 88,188 | ||
| Calibration 3 | 87,822 | ||
| ssj_ops@calibrated=88,005 | |||
| 100% | 99.2% | 88,005 | 87,284 |
| 90% | 89.3% | 79,205 | 78,547 |
| 80% | 81.0% | 70,404 | 71,304 |
| 70% | 70.6% | 61,604 | 62,158 |
| 60% | 59.2% | 52,803 | 52,071 |
| 50% | 50.4% | 44,003 | 44,384 |
| 40% | 39.5% | 35,202 | 34,721 |
| 30% | 30.6% | 26,402 | 26,922 |
| 20% | 19.9% | 17,601 | 17,511 |
| 10% | 10.3% | 8,801 | 9,100 |
| Active Idle | 0 | 0 | |

| Target Load | Actual Load | ssj_ops | |
|---|---|---|---|
| Target | Actual | ||
| Calibration 1 | 83,341 | ||
| Calibration 2 | 88,555 | ||
| Calibration 3 | 88,389 | ||
| ssj_ops@calibrated=88,472 | |||
| 100% | 100.0% | 88,472 | 88,429 |
| 90% | 89.4% | 79,625 | 79,083 |
| 80% | 81.1% | 70,778 | 71,782 |
| 70% | 70.1% | 61,931 | 62,008 |
| 60% | 60.2% | 53,083 | 53,304 |
| 50% | 50.3% | 44,236 | 44,465 |
| 40% | 39.2% | 35,389 | 34,723 |
| 30% | 29.6% | 26,542 | 26,171 |
| 20% | 19.9% | 17,694 | 17,601 |
| 10% | 9.8% | 8,847 | 8,708 |
| Active Idle | 0 | 0 | |
