
SPECpower_ssj2008
Host 'M620-11' Performance Report
Copyright © 2007-2013 Standard Performance Evaluation Corporation
| Dell Inc. PowerEdge M620 (Intel Xeon E5-2670, 2.60 GHz) | ssj_ops@100% = 1,425,270 ssj_ops@100% per JVM = 89,079 |
||||
| Test Sponsor: | Dell Inc. | SPEC License #: | 55 | Test Method: | Multi Node |
| Tested By: | Dell Inc. | Test Location: | Round Rock, TX, USA | Test Date: | Jan 11, 2013 |
| Hardware Availability: | Dec-2012 | Software Availability: | Jun-2012 | Publication: | Feb 20, 2013 |
| System Source: | Single Supplier | System Designation: | Server | Power Provisioning: | Line-powered |
| Target Load | Actual Load | ssj_ops | |
|---|---|---|---|
| Target | Actual | ||
| Calibration 1 | 1,343,653 | ||
| Calibration 2 | 1,426,809 | ||
| Calibration 3 | 1,427,691 | ||
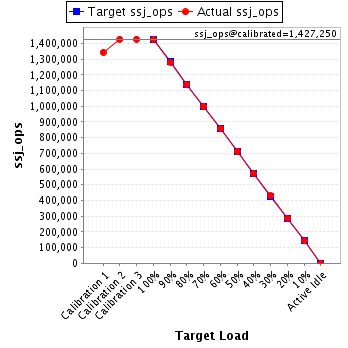
| ssj_ops@calibrated=1,427,250 | |||
| 100% | 99.9% | 1,427,250 | 1,425,270 |
| 90% | 89.8% | 1,284,525 | 1,281,786 |
| 80% | 79.8% | 1,141,800 | 1,139,194 |
| 70% | 69.9% | 999,075 | 998,251 |
| 60% | 60.0% | 856,350 | 856,490 |
| 50% | 50.0% | 713,625 | 713,957 |
| 40% | 40.0% | 570,900 | 571,112 |
| 30% | 30.1% | 428,175 | 429,113 |
| 20% | 20.2% | 285,450 | 288,286 |
| 10% | 10.0% | 142,725 | 142,943 |
| Active Idle | 0 | 0 | |
| Set Identifier: | sut |
| Set Description: | M620 |
| # of Identical Nodes: | 16 |
| Comment: | None |
| Hardware | |
|---|---|
| Hardware Vendor: | Dell Inc. |
| Model: | PowerEdge M620 (Intel Xeon E5-2670, 2.60 GHz) |
| Form Factor: | Blade |
| CPU Name: | Intel Xeon E5-2670 2.60 GHz |
| CPU Characteristics: | 8 Core, 2.60 GHz, 20MB L3 Cache |
| CPU Frequency (MHz): | 2600 |
| CPU(s) Enabled: | 16 cores, 2 chips, 8 cores/chip |
| Hardware Threads: | 32 (2 / core) |
| CPU(s) Orderable: | 1,2 chips |
| Primary Cache: | 32 KB I + 32 KB D on chip per core |
| Secondary Cache: | 256 KB I+D on chip per chip |
| Tertiary Cache: | 20 MB I+D on chip per chip |
| Other Cache: | None |
| Memory Amount (GB): | 24 |
| # and size of DIMM: | 6 x 4096 MB |
| Memory Details: | 4GB 2Rx8 PC3L-10600E-9 ECC, Slots A1-3, B1-3 populated |
| Power Supply Quantity and Rating (W): | None |
| Power Supply Details: | Shared |
| Disk Drive: | 1 x 100 GB 2.5" SATA SSD, Dell P/N: DYW42 |
| Disk Controller: | Integrated PERC S110 |
| # and type of Network Interface Cards (NICs) Installed: | 1 x Onboard Dual-Port Intel X520-k Gigabit Ethernet |
| NICs Enabled in Firmware / OS / Connected: | 2/2/1 |
| Network Speed (Mbit): | 1000 |
| Keyboard: | None |
| Mouse: | None |
| Monitor: | None |
| Optical Drives: | No |
| Other Hardware: | None |
| Software | |
|---|---|
| Power Management: | Power Saver Mode in OS (See Notes) |
| Operating System (OS): | Microsoft Windows Server 2008 Enterprise x64 Edition |
| OS Version: | R2 SP1 |
| Filesystem: | NTFS |
| JVM Vendor: | IBM Corporation |
| JVM Version: | IBM J9 VM (build 2.6, JRE 1.7.0 Windows Server 2008 R2 amd64-64 20120322_106209 (JIT enabled, AOT enabled) |
| JVM Command-line Options: | -Xaggressive -Xcompressedrefs -Xmn800m -Xms1024m -Xmx1024m -XlockReservation -Xnoloa -Xlp -Xconcurrentlevel0 -XtlhPrefetch -Xthr:minimizeusercpu -Xgcthreads4 |
| JVM Affinity: | start /affinity [3, C, 30, C0, 300, C00, 3000, C000, 30000, C0000, 300000, C00000, 3000000, C0000000, 30000000, C0000000] |
| JVM Instances: | 16 |
| JVM Initial Heap (MB): | 1024 |
| JVM Maximum Heap (MB): | 1024 |
| JVM Address Bits: | 64 |
| Boot Firmware Version: | 1.4.9 |
| Management Firmware Version: | iDRAC7 1.30.30 (Build 39) |
| Workload Version: | SSJ 1.2.10 |
| Director Location: | Controller |
| Other Software: | IBM SDK Java Technology Edition Version 7.0 for Windows x64 |
| JVM Instance | ssj_ops@100% |
|---|---|
| M620-11.001 | 87,410 |
| M620-11.002 | 88,722 |
| M620-11.003 | 89,466 |
| M620-11.004 | 89,389 |
| M620-11.005 | 90,417 |
| M620-11.006 | 89,608 |
| M620-11.007 | 88,687 |
| M620-11.008 | 90,104 |
| M620-11.009 | 89,763 |
| M620-11.010 | 88,834 |
| M620-11.011 | 87,681 |
| M620-11.012 | 89,023 |
| M620-11.013 | 88,473 |
| M620-11.014 | 89,101 |
| M620-11.015 | 89,550 |
| M620-11.016 | 89,041 |
| ssj_ops@100% | 1,425,270 |
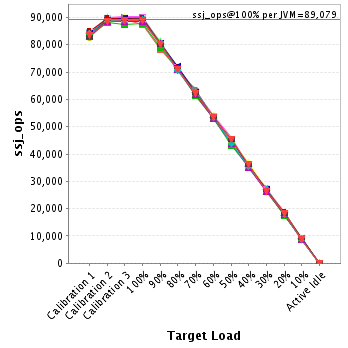
| ssj_ops@100% per JVM | 89,079 |
| Target Load | Actual Load | ssj_ops | |
|---|---|---|---|
| Target | Actual | ||
| Calibration 1 | 83,448 | ||
| Calibration 2 | 88,354 | ||
| Calibration 3 | 89,235 | ||
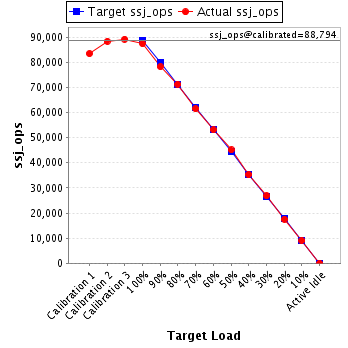
| ssj_ops@calibrated=88,794 | |||
| 100% | 98.4% | 88,794 | 87,410 |
| 90% | 88.1% | 79,915 | 78,244 |
| 80% | 80.3% | 71,035 | 71,266 |
| 70% | 69.3% | 62,156 | 61,502 |
| 60% | 59.8% | 53,277 | 53,117 |
| 50% | 50.8% | 44,397 | 45,144 |
| 40% | 39.7% | 35,518 | 35,277 |
| 30% | 30.2% | 26,638 | 26,812 |
| 20% | 19.7% | 17,759 | 17,522 |
| 10% | 10.2% | 8,879 | 9,045 |
| Active Idle | 0 | 0 | |
| Target Load | Actual Load | ssj_ops | |
|---|---|---|---|
| Target | Actual | ||
| Calibration 1 | 83,523 | ||
| Calibration 2 | 88,912 | ||
| Calibration 3 | 88,853 | ||
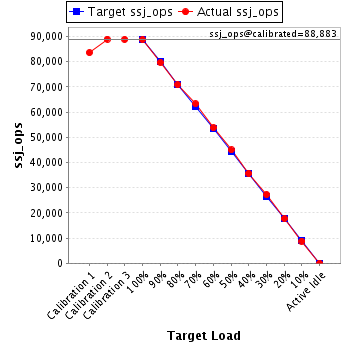
| ssj_ops@calibrated=88,883 | |||
| 100% | 99.8% | 88,883 | 88,722 |
| 90% | 89.6% | 79,994 | 79,641 |
| 80% | 79.7% | 71,106 | 70,822 |
| 70% | 71.2% | 62,218 | 63,254 |
| 60% | 60.4% | 53,330 | 53,710 |
| 50% | 50.6% | 44,441 | 45,007 |
| 40% | 40.1% | 35,553 | 35,672 |
| 30% | 30.6% | 26,665 | 27,209 |
| 20% | 19.9% | 17,777 | 17,694 |
| 10% | 9.9% | 8,888 | 8,791 |
| Active Idle | 0 | 0 | |
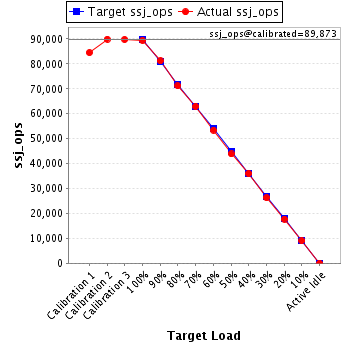
| Target Load | Actual Load | ssj_ops | |
|---|---|---|---|
| Target | Actual | ||
| Calibration 1 | 84,464 | ||
| Calibration 2 | 89,927 | ||
| Calibration 3 | 89,818 | ||
| ssj_ops@calibrated=89,873 | |||
| 100% | 99.5% | 89,873 | 89,466 |
| 90% | 90.3% | 80,885 | 81,194 |
| 80% | 79.2% | 71,898 | 71,160 |
| 70% | 70.1% | 62,911 | 63,024 |
| 60% | 59.5% | 53,924 | 53,475 |
| 50% | 48.8% | 44,936 | 43,846 |
| 40% | 40.0% | 35,949 | 35,968 |
| 30% | 29.2% | 26,962 | 26,263 |
| 20% | 19.7% | 17,975 | 17,749 |
| 10% | 10.1% | 8,987 | 9,057 |
| Active Idle | 0 | 0 | |
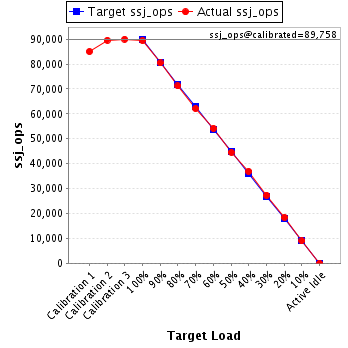
| Target Load | Actual Load | ssj_ops | |
|---|---|---|---|
| Target | Actual | ||
| Calibration 1 | 84,959 | ||
| Calibration 2 | 89,531 | ||
| Calibration 3 | 89,985 | ||
| ssj_ops@calibrated=89,758 | |||
| 100% | 99.6% | 89,758 | 89,389 |
| 90% | 89.6% | 80,782 | 80,421 |
| 80% | 79.3% | 71,806 | 71,188 |
| 70% | 69.2% | 62,831 | 62,094 |
| 60% | 60.4% | 53,855 | 54,180 |
| 50% | 49.6% | 44,879 | 44,520 |
| 40% | 41.1% | 35,903 | 36,911 |
| 30% | 30.5% | 26,927 | 27,363 |
| 20% | 20.6% | 17,952 | 18,449 |
| 10% | 10.0% | 8,976 | 8,966 |
| Active Idle | 0 | 0 | |
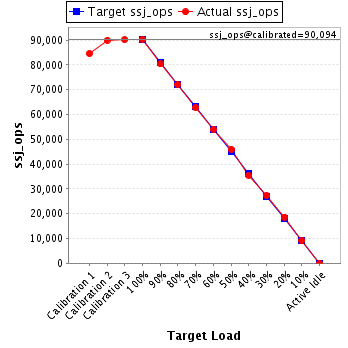
| Target Load | Actual Load | ssj_ops | |
|---|---|---|---|
| Target | Actual | ||
| Calibration 1 | 84,609 | ||
| Calibration 2 | 89,974 | ||
| Calibration 3 | 90,213 | ||
| ssj_ops@calibrated=90,094 | |||
| 100% | 100.4% | 90,094 | 90,417 |
| 90% | 89.3% | 81,084 | 80,440 |
| 80% | 80.0% | 72,075 | 72,098 |
| 70% | 69.7% | 63,066 | 62,786 |
| 60% | 60.0% | 54,056 | 54,093 |
| 50% | 51.0% | 45,047 | 45,973 |
| 40% | 39.5% | 36,037 | 35,556 |
| 30% | 30.4% | 27,028 | 27,382 |
| 20% | 20.7% | 18,019 | 18,650 |
| 10% | 10.1% | 9,009 | 9,058 |
| Active Idle | 0 | 0 | |
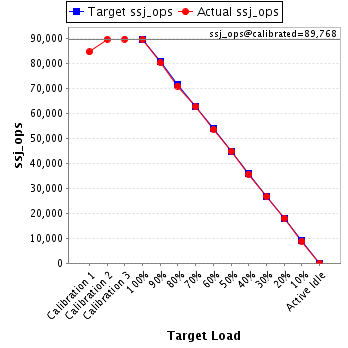
| Target Load | Actual Load | ssj_ops | |
|---|---|---|---|
| Target | Actual | ||
| Calibration 1 | 84,666 | ||
| Calibration 2 | 89,731 | ||
| Calibration 3 | 89,804 | ||
| ssj_ops@calibrated=89,768 | |||
| 100% | 99.8% | 89,768 | 89,608 |
| 90% | 89.6% | 80,791 | 80,407 |
| 80% | 79.1% | 71,814 | 71,036 |
| 70% | 69.8% | 62,837 | 62,678 |
| 60% | 59.8% | 53,861 | 53,664 |
| 50% | 50.0% | 44,884 | 44,897 |
| 40% | 39.8% | 35,907 | 35,751 |
| 30% | 29.7% | 26,930 | 26,689 |
| 20% | 20.0% | 17,954 | 17,981 |
| 10% | 9.9% | 8,977 | 8,854 |
| Active Idle | 0 | 0 | |
| Target Load | Actual Load | ssj_ops | |
|---|---|---|---|
| Target | Actual | ||
| Calibration 1 | 84,696 | ||
| Calibration 2 | 89,410 | ||
| Calibration 3 | 89,145 | ||
| ssj_ops@calibrated=89,278 | |||
| 100% | 99.3% | 89,278 | 88,687 |
| 90% | 89.2% | 80,350 | 79,614 |
| 80% | 79.2% | 71,422 | 70,703 |
| 70% | 69.6% | 62,494 | 62,138 |
| 60% | 60.1% | 53,567 | 53,648 |
| 50% | 49.6% | 44,639 | 44,292 |
| 40% | 40.2% | 35,711 | 35,892 |
| 30% | 30.5% | 26,783 | 27,234 |
| 20% | 20.6% | 17,856 | 18,392 |
| 10% | 9.7% | 8,928 | 8,662 |
| Active Idle | 0 | 0 | |
| Target Load | Actual Load | ssj_ops | |
|---|---|---|---|
| Target | Actual | ||
| Calibration 1 | 84,206 | ||
| Calibration 2 | 89,664 | ||
| Calibration 3 | 89,835 | ||
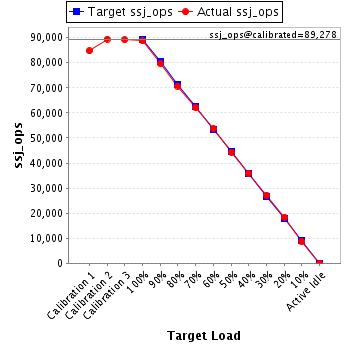
| ssj_ops@calibrated=89,749 | |||
| 100% | 100.4% | 89,749 | 90,104 |
| 90% | 89.8% | 80,774 | 80,616 |
| 80% | 79.0% | 71,799 | 70,880 |
| 70% | 71.0% | 62,824 | 63,733 |
| 60% | 59.3% | 53,850 | 53,214 |
| 50% | 49.5% | 44,875 | 44,467 |
| 40% | 39.4% | 35,900 | 35,383 |
| 30% | 29.7% | 26,925 | 26,620 |
| 20% | 20.6% | 17,950 | 18,501 |
| 10% | 10.0% | 8,975 | 8,981 |
| Active Idle | 0 | 0 | |
| Target Load | Actual Load | ssj_ops | |
|---|---|---|---|
| Target | Actual | ||
| Calibration 1 | 84,859 | ||
| Calibration 2 | 89,787 | ||
| Calibration 3 | 89,788 | ||
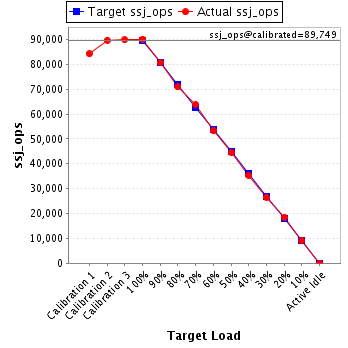
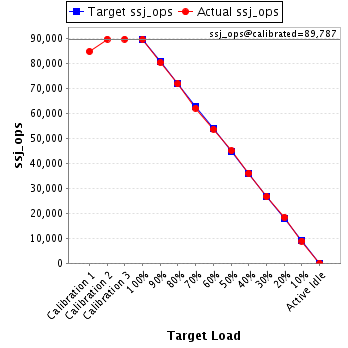
| ssj_ops@calibrated=89,787 | |||
| 100% | 100.0% | 89,787 | 89,763 |
| 90% | 89.6% | 80,808 | 80,460 |
| 80% | 80.0% | 71,830 | 71,856 |
| 70% | 69.2% | 62,851 | 62,160 |
| 60% | 59.8% | 53,872 | 53,728 |
| 50% | 50.3% | 44,894 | 45,121 |
| 40% | 40.2% | 35,915 | 36,085 |
| 30% | 29.7% | 26,936 | 26,703 |
| 20% | 20.5% | 17,957 | 18,445 |
| 10% | 9.9% | 8,979 | 8,908 |
| Active Idle | 0 | 0 | |
| Target Load | Actual Load | ssj_ops | |
|---|---|---|---|
| Target | Actual | ||
| Calibration 1 | 84,004 | ||
| Calibration 2 | 89,021 | ||
| Calibration 3 | 89,452 | ||
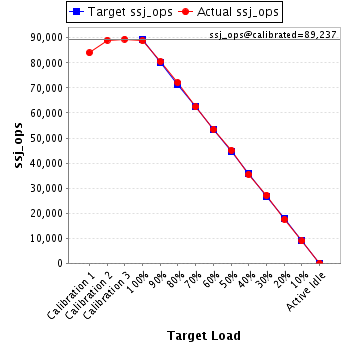
| ssj_ops@calibrated=89,237 | |||
| 100% | 99.5% | 89,237 | 88,834 |
| 90% | 90.2% | 80,313 | 80,510 |
| 80% | 80.8% | 71,389 | 72,102 |
| 70% | 69.9% | 62,466 | 62,407 |
| 60% | 59.9% | 53,542 | 53,425 |
| 50% | 50.6% | 44,618 | 45,110 |
| 40% | 39.7% | 35,695 | 35,442 |
| 30% | 30.4% | 26,771 | 27,156 |
| 20% | 19.6% | 17,847 | 17,524 |
| 10% | 10.0% | 8,924 | 8,895 |
| Active Idle | 0 | 0 | |
| Target Load | Actual Load | ssj_ops | |
|---|---|---|---|
| Target | Actual | ||
| Calibration 1 | 83,456 | ||
| Calibration 2 | 88,008 | ||
| Calibration 3 | 87,575 | ||
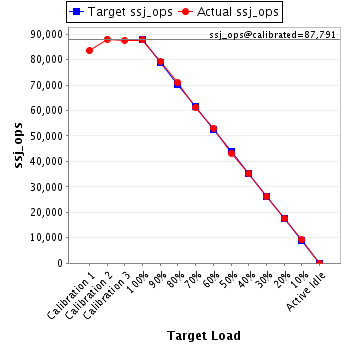
| ssj_ops@calibrated=87,791 | |||
| 100% | 99.9% | 87,791 | 87,681 |
| 90% | 90.2% | 79,012 | 79,177 |
| 80% | 80.7% | 70,233 | 70,854 |
| 70% | 69.9% | 61,454 | 61,365 |
| 60% | 60.4% | 52,675 | 53,030 |
| 50% | 49.3% | 43,896 | 43,284 |
| 40% | 40.3% | 35,117 | 35,349 |
| 30% | 29.8% | 26,337 | 26,185 |
| 20% | 19.9% | 17,558 | 17,492 |
| 10% | 10.5% | 8,779 | 9,207 |
| Active Idle | 0 | 0 | |
| Target Load | Actual Load | ssj_ops | |
|---|---|---|---|
| Target | Actual | ||
| Calibration 1 | 82,706 | ||
| Calibration 2 | 89,076 | ||
| Calibration 3 | 88,534 | ||
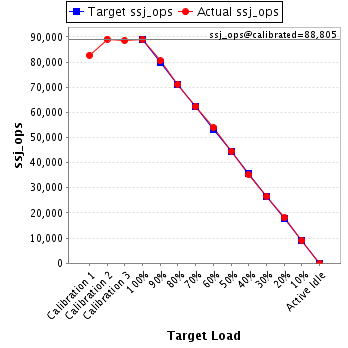
| ssj_ops@calibrated=88,805 | |||
| 100% | 100.2% | 88,805 | 89,023 |
| 90% | 90.6% | 79,924 | 80,452 |
| 80% | 80.1% | 71,044 | 71,147 |
| 70% | 70.2% | 62,163 | 62,300 |
| 60% | 60.7% | 53,283 | 53,871 |
| 50% | 50.1% | 44,402 | 44,520 |
| 40% | 39.6% | 35,522 | 35,177 |
| 30% | 30.1% | 26,641 | 26,722 |
| 20% | 20.4% | 17,761 | 18,109 |
| 10% | 10.1% | 8,880 | 8,979 |
| Active Idle | 0 | 0 | |
| Target Load | Actual Load | ssj_ops | |
|---|---|---|---|
| Target | Actual | ||
| Calibration 1 | 83,193 | ||
| Calibration 2 | 88,679 | ||
| Calibration 3 | 88,352 | ||
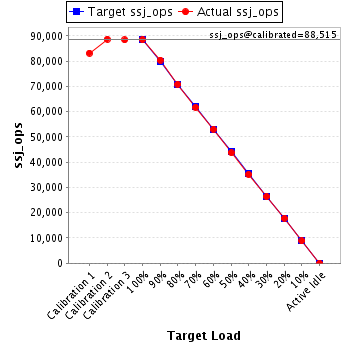
| ssj_ops@calibrated=88,515 | |||
| 100% | 100.0% | 88,515 | 88,473 |
| 90% | 90.9% | 79,664 | 80,429 |
| 80% | 80.0% | 70,812 | 70,845 |
| 70% | 69.7% | 61,961 | 61,723 |
| 60% | 60.0% | 53,109 | 53,067 |
| 50% | 49.4% | 44,258 | 43,718 |
| 40% | 39.7% | 35,406 | 35,154 |
| 30% | 29.8% | 26,555 | 26,395 |
| 20% | 20.2% | 17,703 | 17,870 |
| 10% | 10.0% | 8,852 | 8,866 |
| Active Idle | 0 | 0 | |
| Target Load | Actual Load | ssj_ops | |
|---|---|---|---|
| Target | Actual | ||
| Calibration 1 | 84,306 | ||
| Calibration 2 | 88,888 | ||
| Calibration 3 | 88,936 | ||
| ssj_ops@calibrated=88,912 | |||
| 100% | 100.2% | 88,912 | 89,101 |
| 90% | 90.1% | 80,021 | 80,070 |
| 80% | 79.2% | 71,130 | 70,438 |
| 70% | 70.2% | 62,239 | 62,374 |
| 60% | 60.0% | 53,347 | 53,357 |
| 50% | 49.1% | 44,456 | 43,697 |
| 40% | 39.9% | 35,565 | 35,483 |
| 30% | 30.3% | 26,674 | 26,921 |
| 20% | 20.2% | 17,782 | 17,945 |
| 10% | 9.8% | 8,891 | 8,696 |
| Active Idle | 0 | 0 | |

| Target Load | Actual Load | ssj_ops | |
|---|---|---|---|
| Target | Actual | ||
| Calibration 1 | 83,028 | ||
| Calibration 2 | 89,317 | ||
| Calibration 3 | 89,408 | ||
| ssj_ops@calibrated=89,363 | |||
| 100% | 100.2% | 89,363 | 89,550 |
| 90% | 89.5% | 80,426 | 79,942 |
| 80% | 80.4% | 71,490 | 71,817 |
| 70% | 69.8% | 62,554 | 62,409 |
| 60% | 59.8% | 53,618 | 53,423 |
| 50% | 50.6% | 44,681 | 45,198 |
| 40% | 40.3% | 35,745 | 35,971 |
| 30% | 30.2% | 26,809 | 26,998 |
| 20% | 20.0% | 17,873 | 17,908 |
| 10% | 10.4% | 8,936 | 9,272 |
| Active Idle | 0 | 0 | |

| Target Load | Actual Load | ssj_ops | |
|---|---|---|---|
| Target | Actual | ||
| Calibration 1 | 83,532 | ||
| Calibration 2 | 88,530 | ||
| Calibration 3 | 88,758 | ||
| ssj_ops@calibrated=88,644 | |||
| 100% | 100.4% | 88,644 | 89,041 |
| 90% | 90.4% | 79,779 | 80,166 |
| 80% | 80.1% | 70,915 | 70,982 |
| 70% | 70.3% | 62,051 | 62,303 |
| 60% | 60.3% | 53,186 | 53,489 |
| 50% | 50.9% | 44,322 | 45,161 |
| 40% | 40.7% | 35,457 | 36,040 |
| 30% | 29.8% | 26,593 | 26,460 |
| 20% | 20.4% | 17,729 | 18,055 |
| 10% | 9.8% | 8,864 | 8,706 |
| Active Idle | 0 | 0 | |
