SPECpower_ssj2008
Aggregate Performance Report
Copyright © 2007-2013 Standard Performance Evaluation Corporation
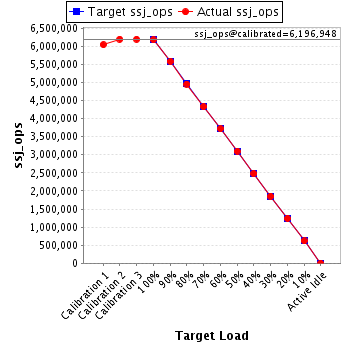
| Dell Inc. PowerEdge C6145 (AMD Opteron 6380, 2.50 GHz) | ssj_ops@100% = 6,175,935 ssj_ops@100% per Host = 3,087,968 ssj_ops@100% per JVM = 192,998 |
||||
| Test Sponsor: | Dell Inc. | SPEC License #: | 55 | Test Method: | Multi Node |
| Tested By: | Dell Inc. | Test Location: | Round Rock, TX, USA | Test Date: | Oct 11, 2012 |
| Hardware Availability: | Feb-2013 | Software Availability: | Jun-2012 | Publication: | Jan 9, 2013 |
| System Source: | Single Supplier | System Designation: | Server | Power Provisioning: | Line-powered |
| Target Load | Actual Load | ssj_ops | |
|---|---|---|---|
| Target | Actual | ||
| Calibration 1 | 6,044,416 | ||
| Calibration 2 | 6,197,211 | ||
| Calibration 3 | 6,196,686 | ||
| ssj_ops@calibrated=6,196,948 | |||
| 100% | 99.7% | 6,196,948 | 6,175,935 |
| 90% | 90.1% | 5,577,253 | 5,581,622 |
| 80% | 80.0% | 4,957,559 | 4,956,293 |
| 70% | 69.9% | 4,337,864 | 4,329,738 |
| 60% | 60.0% | 3,718,169 | 3,715,392 |
| 50% | 50.0% | 3,098,474 | 3,100,961 |
| 40% | 39.9% | 2,478,779 | 2,475,257 |
| 30% | 29.9% | 1,859,084 | 1,855,965 |
| 20% | 20.0% | 1,239,390 | 1,241,035 |
| 10% | 10.0% | 619,695 | 616,627 |
| Active Idle | 0 | 0 | |

| # of Nodes | # of Chips | # of Cores | # of Threads | Total RAM (GB) | # of OS Images | # of JVM Instances |
|---|---|---|---|---|---|---|
| 2 | 8 | 128 | 128 | 128 | 2 | 32 |
| Set Identifier: | sut |
| Set Description: | System Under Test |
| # of Identical Nodes: | 2 |
| Comment: | None |
| Hardware per Node | |
|---|---|
| Hardware Vendor: | Dell Inc. |
| Model: | PowerEdge C6145 (AMD Opteron 6380, 2.50 GHz) |
| Form Factor: | Blade |
| CPU Name: | AMD Opteron 6380 (2.50GHz) |
| CPU Characteristics: | 16-Core, 2.50GHz, 16MB L3 Cache |
| CPU Frequency (MHz): | 2500 |
| CPU(s) Enabled: | 64 cores, 4 chips, 16 cores/chip |
| Hardware Threads: | 64 (1 / core) |
| CPU(s) Orderable: | 2,4 chips |
| Primary Cache: | 512 KB I + 256 KB D on chip per chip |
| Secondary Cache: | 16 MB I+D on chip per chip, 2 MB shared / 2 cores |
| Tertiary Cache: | 16 MB I+D on chip per chip, 8MB shared / 8 cores |
| Other Cache: | None |
| Memory Amount (GB): | 64 |
| # and size of DIMM: | 16 x 4096 MB |
| Memory Details: | 4GB 2Rx8 PC3L-10600R ECC ; Slots A1-A4, B1-B4, C1-C4, D1-D4 populated |
| Power Supply Quantity and Rating (W): | None |
| Power Supply Details: | N/A |
| Disk Drive: | 1 x 500GB 2.5" SATA 7200 RPM (Dell PN: TH2NR) |
| Disk Controller: | Onboard SATA |
| # and type of Network Interface Cards (NICs) Installed: | 1 x Intel(R) 82576 Gigabit Dual Port Network Connection |
| NICs Enabled in Firmware / OS / Connected: | 1/1/1 |
| Network Speed (Mbit): | 1000 |
| Keyboard: | None |
| Mouse: | None |
| Monitor: | None |
| Optical Drives: | No |
| Other Hardware: | None |
| Software per Node | |
|---|---|
| Power Management: | Power Saver plan in OS |
| Operating System (OS): | Microsoft Windows 2008 Enterprise x64 Edition |
| OS Version: | R2 SP1 (64-bit) |
| Filesystem: | NTFS |
| JVM Vendor: | IBM Corporation |
| JVM Version: | IBM J9 VM (build 2.6, JRE 1.7.0 Windows Server 2008 R2 amd64-64 20120322_106209 (JIT enabled, AOT enabled) |
| JVM Command-line Options: | -Xaggressive -Xcompressedrefs -Xmn1400m -Xms1875m -Xmx1875m -XlockReservation -Xnoloa -Xlp -Xconcurrentlevel0 -Xthr:minimizeusercpu |
| JVM Affinity: | start /affinity [F, F0, F00, F000, F0000,F00000, F000000, F0000000, F00000000,F000000000, F0000000000, F00000000000,F000000000000, F0000000000000,F00000000000000, F000000000000000] |
| JVM Instances: | 16 |
| JVM Initial Heap (MB): | 1875 |
| JVM Maximum Heap (MB): | 1875 |
| JVM Address Bits: | 64 |
| Boot Firmware Version: | 3.0.0 |
| Management Firmware Version: | 1.11 |
| Workload Version: | SSJ 1.2.10 |
| Director Location: | Controller |
| Other Software: | IBM SDK Java Technology Edition Version 7.0 for Windows |
| Host | ssj_ops@100% |
|---|---|
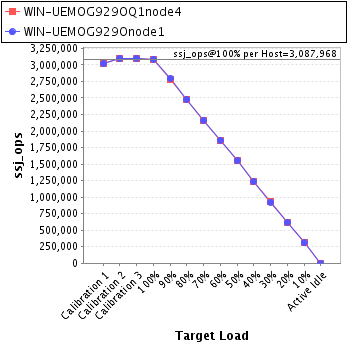
| WIN-UEMOG929OQ1node4 | 3,087,521 |
| WIN-UEMOG929Onode1 | 3,088,414 |
| ssj_ops@100% | 6,175,935 |
| ssj_ops@100% per Host | 3,087,968 |
| ssj_ops@100% per JVM | 192,998 |

| Target Load | Actual Load | ssj_ops | |
|---|---|---|---|
| Target | Actual | ||
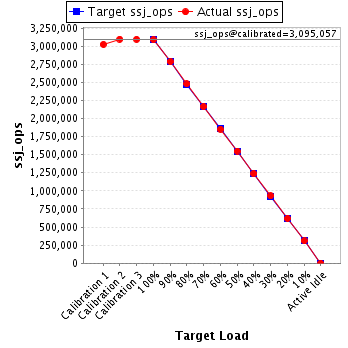
| Calibration 1 | 3,023,353 | ||
| Calibration 2 | 3,095,788 | ||
| Calibration 3 | 3,094,326 | ||
| ssj_ops@calibrated=3,095,057 | |||
| 100% | 99.8% | 3,095,057 | 3,087,521 |
| 90% | 90.0% | 2,785,552 | 2,786,043 |
| 80% | 80.0% | 2,476,046 | 2,477,312 |
| 70% | 69.9% | 2,166,540 | 2,164,891 |
| 60% | 59.8% | 1,857,034 | 1,852,370 |
| 50% | 50.1% | 1,547,529 | 1,550,622 |
| 40% | 39.9% | 1,238,023 | 1,235,901 |
| 30% | 30.0% | 928,517 | 929,349 |
| 20% | 20.0% | 619,011 | 620,234 |
| 10% | 10.0% | 309,506 | 308,718 |
| Active Idle | 0 | 0 | |

| Target Load | Actual Load | ssj_ops | |
|---|---|---|---|
| Target | Actual | ||
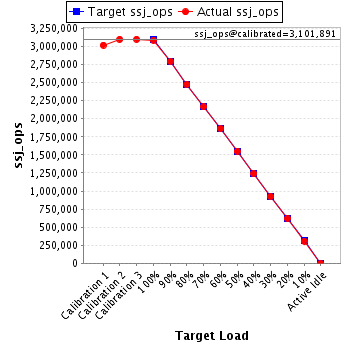
| Calibration 1 | 3,021,063 | ||
| Calibration 2 | 3,101,423 | ||
| Calibration 3 | 3,102,359 | ||
| ssj_ops@calibrated=3,101,891 | |||
| 100% | 99.6% | 3,101,891 | 3,088,414 |
| 90% | 90.1% | 2,791,702 | 2,795,579 |
| 80% | 79.9% | 2,481,513 | 2,478,981 |
| 70% | 69.8% | 2,171,324 | 2,164,848 |
| 60% | 60.1% | 1,861,135 | 1,863,022 |
| 50% | 50.0% | 1,550,945 | 1,550,340 |
| 40% | 40.0% | 1,240,756 | 1,239,356 |
| 30% | 29.9% | 930,567 | 926,616 |
| 20% | 20.0% | 620,378 | 620,801 |
| 10% | 9.9% | 310,189 | 307,910 |
| Active Idle | 0 | 0 | |
