SPECpower_ssj2008
Host 'steel2' Performance Report
Copyright © 2007-2012 Standard Performance Evaluation Corporation
| SGI Rackable C2112-4RP4 | ssj_ops@100% = 1,452,523 ssj_ops@100% per JVM = 181,565 |
||||
| Test Sponsor: | SGI | SPEC License #: | 4 | Test Method: | Multi Node |
| Tested By: | SGI | Test Location: | Fremont, CA, USA | Test Date: | Oct 2, 2012 |
| Hardware Availability: | Aug-2012 | Software Availability: | Jun-2012 | Publication: | Oct 17, 2012 |
| System Source: | Single Supplier | System Designation: | Server | Power Provisioning: | Line-powered |
| Target Load | Actual Load | ssj_ops | |
|---|---|---|---|
| Target | Actual | ||
| Calibration 1 | 1,432,645 | ||
| Calibration 2 | 1,459,519 | ||
| Calibration 3 | 1,459,060 | ||
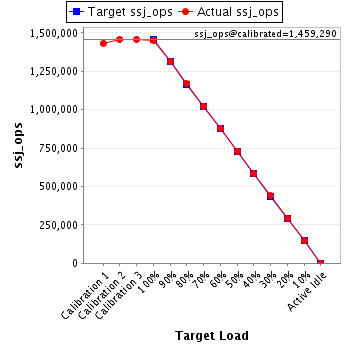
| ssj_ops@calibrated=1,459,290 | |||
| 100% | 99.5% | 1,459,290 | 1,452,523 |
| 90% | 90.0% | 1,313,361 | 1,313,617 |
| 80% | 80.1% | 1,167,432 | 1,169,484 |
| 70% | 69.8% | 1,021,503 | 1,019,221 |
| 60% | 60.1% | 875,574 | 876,619 |
| 50% | 50.0% | 729,645 | 730,176 |
| 40% | 39.9% | 583,716 | 582,770 |
| 30% | 30.1% | 437,787 | 438,577 |
| 20% | 20.0% | 291,858 | 291,942 |
| 10% | 10.0% | 145,929 | 145,233 |
| Active Idle | 0 | 0 | |
| Set Identifier: | sut |
| Set Description: | Rackable C2112-4RP4 |
| # of Identical Nodes: | 4 |
| Comment: | None |
| Hardware | |
|---|---|
| Hardware Vendor: | SGI |
| Model: | Rackable C2112-4RP4 |
| Form Factor: | Blade |
| CPU Name: | Intel Xeon E5-2660 |
| CPU Characteristics: | 8-Core, 2.20 GHz, 20 MB L3 Cache (Turbo Boost Technology up to 3.0 GHz) |
| CPU Frequency (MHz): | 2200 |
| CPU(s) Enabled: | 16 cores, 2 chips, 8 cores/chip |
| Hardware Threads: | 32 (2 / core) |
| CPU(s) Orderable: | 1,2 chips |
| Primary Cache: | 32 KB I + 32 KB D on chip per core |
| Secondary Cache: | 256 KB I+D on chip per core |
| Tertiary Cache: | 20 MB I+D on chip per chip |
| Other Cache: | None |
| Memory Amount (GB): | 24 |
| # and size of DIMM: | 6 x 4096 MB |
| Memory Details: | 4 GB 2Rx8 PC3L-10600R slots A1,B1 C1,E1,F1 and G1 are populated. |
| Power Supply Quantity and Rating (W): | None |
| Power Supply Details: | N/A |
| Disk Drive: | 1 x 120 GB 2.5" SSD SATA (SGI PN LSX-SSD25-120G-I) |
| Disk Controller: | Integrated SATA controller |
| # and type of Network Interface Cards (NICs) Installed: | 1 x Dual port Integrated Intel(R) I350 Gigabit Ethernet Controller |
| NICs Enabled in Firmware / OS / Connected: | 2/2/1 |
| Network Speed (Mbit): | 1000 |
| Keyboard: | None |
| Mouse: | None |
| Monitor: | None |
| Optical Drives: | No |
| Other Hardware: | None |
| Software | |
|---|---|
| Power Management: | Power Saver Enabled in OS |
| Operating System (OS): | Microsoft Windows Server 2008 Datacenter Edition |
| OS Version: | R2 |
| Filesystem: | NTFS |
| JVM Vendor: | IBM Corporation |
| JVM Version: | IBM J9 VM (build 2.6,JRE 1.7.0 Windows Server 2008 R2 amd64-64 20120322_106209 (JIT enabled, AOT enabled) |
| JVM Command-line Options: | -Xaggressive -Xcompressedrefs -Xmx1600m -Xms1600m -Xmn1200m -XlockReservation -Xnoloa -XtlhPrefetch -Xlp -Xconcurrentlevel0 |
| JVM Affinity: | start /affinity [F, F0, F00, F000, F0000, F00000, F000000, F0000000] |
| JVM Instances: | 8 |
| JVM Initial Heap (MB): | 1600 |
| JVM Maximum Heap (MB): | 1600 |
| JVM Address Bits: | 64 |
| Boot Firmware Version: | SE5C600.86B.01.03.0002 dt 06/20/2012 |
| Management Firmware Version: | none |
| Workload Version: | SSJ 1.2.9 |
| Director Location: | Controller |
| Other Software: | IBM SDK Java Technology Edition Version 7.0 for Windows x64 |
| JVM Instance | ssj_ops@100% |
|---|---|
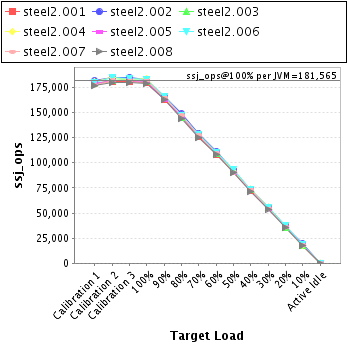
| steel2.001 | 180,253 |
| steel2.002 | 183,008 |
| steel2.003 | 181,127 |
| steel2.004 | 183,547 |
| steel2.005 | 181,234 |
| steel2.006 | 182,918 |
| steel2.007 | 181,413 |
| steel2.008 | 179,023 |
| ssj_ops@100% | 1,452,523 |
| ssj_ops@100% per JVM | 181,565 |
| Target Load | Actual Load | ssj_ops | |
|---|---|---|---|
| Target | Actual | ||
| Calibration 1 | 178,695 | ||
| Calibration 2 | 181,276 | ||
| Calibration 3 | 180,950 | ||
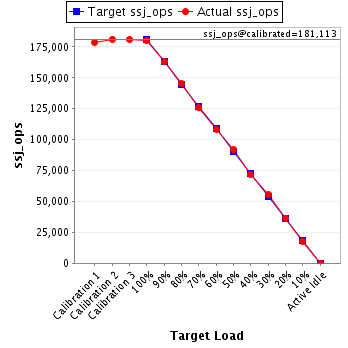
| ssj_ops@calibrated=181,113 | |||
| 100% | 99.5% | 181,113 | 180,253 |
| 90% | 89.9% | 163,002 | 162,868 |
| 80% | 80.2% | 144,890 | 145,217 |
| 70% | 69.6% | 126,779 | 126,035 |
| 60% | 59.8% | 108,668 | 108,278 |
| 50% | 50.7% | 90,556 | 91,766 |
| 40% | 39.8% | 72,445 | 72,030 |
| 30% | 30.7% | 54,334 | 55,553 |
| 20% | 20.2% | 36,223 | 36,577 |
| 10% | 9.9% | 18,111 | 17,893 |
| Active Idle | 0 | 0 | |
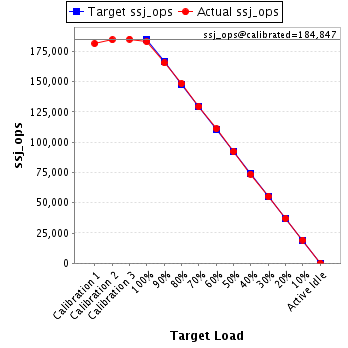
| Target Load | Actual Load | ssj_ops | |
|---|---|---|---|
| Target | Actual | ||
| Calibration 1 | 181,480 | ||
| Calibration 2 | 184,569 | ||
| Calibration 3 | 185,126 | ||
| ssj_ops@calibrated=184,847 | |||
| 100% | 99.0% | 184,847 | 183,008 |
| 90% | 89.6% | 166,363 | 165,548 |
| 80% | 80.3% | 147,878 | 148,510 |
| 70% | 70.0% | 129,393 | 129,412 |
| 60% | 60.1% | 110,908 | 111,170 |
| 50% | 49.9% | 92,424 | 92,257 |
| 40% | 39.8% | 73,939 | 73,536 |
| 30% | 29.8% | 55,454 | 55,110 |
| 20% | 20.0% | 36,969 | 37,004 |
| 10% | 10.4% | 18,485 | 19,217 |
| Active Idle | 0 | 0 | |
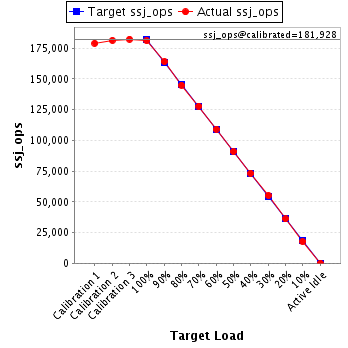
| Target Load | Actual Load | ssj_ops | |
|---|---|---|---|
| Target | Actual | ||
| Calibration 1 | 179,086 | ||
| Calibration 2 | 181,459 | ||
| Calibration 3 | 182,397 | ||
| ssj_ops@calibrated=181,928 | |||
| 100% | 99.6% | 181,928 | 181,127 |
| 90% | 90.2% | 163,735 | 164,088 |
| 80% | 79.7% | 145,543 | 144,946 |
| 70% | 70.3% | 127,350 | 127,947 |
| 60% | 60.0% | 109,157 | 109,175 |
| 50% | 50.0% | 90,964 | 90,967 |
| 40% | 40.3% | 72,771 | 73,291 |
| 30% | 30.3% | 54,578 | 55,163 |
| 20% | 19.8% | 36,386 | 36,041 |
| 10% | 9.8% | 18,193 | 17,748 |
| Active Idle | 0 | 0 | |
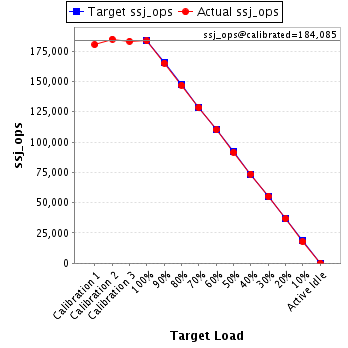
| Target Load | Actual Load | ssj_ops | |
|---|---|---|---|
| Target | Actual | ||
| Calibration 1 | 180,401 | ||
| Calibration 2 | 184,950 | ||
| Calibration 3 | 183,219 | ||
| ssj_ops@calibrated=184,085 | |||
| 100% | 99.7% | 184,085 | 183,547 |
| 90% | 89.7% | 165,676 | 165,160 |
| 80% | 79.8% | 147,268 | 146,924 |
| 70% | 69.8% | 128,859 | 128,458 |
| 60% | 59.9% | 110,451 | 110,236 |
| 50% | 49.8% | 92,042 | 91,630 |
| 40% | 40.0% | 73,634 | 73,656 |
| 30% | 30.0% | 55,225 | 55,198 |
| 20% | 20.0% | 36,817 | 36,739 |
| 10% | 9.7% | 18,408 | 17,872 |
| Active Idle | 0 | 0 | |
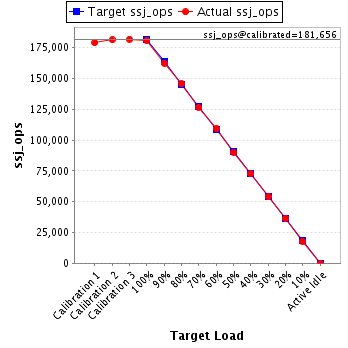
| Target Load | Actual Load | ssj_ops | |
|---|---|---|---|
| Target | Actual | ||
| Calibration 1 | 179,042 | ||
| Calibration 2 | 181,373 | ||
| Calibration 3 | 181,940 | ||
| ssj_ops@calibrated=181,656 | |||
| 100% | 99.8% | 181,656 | 181,234 |
| 90% | 89.5% | 163,491 | 162,510 |
| 80% | 80.2% | 145,325 | 145,650 |
| 70% | 69.8% | 127,159 | 126,720 |
| 60% | 60.2% | 108,994 | 109,345 |
| 50% | 49.7% | 90,828 | 90,236 |
| 40% | 39.9% | 72,662 | 72,570 |
| 30% | 29.7% | 54,497 | 53,881 |
| 20% | 20.1% | 36,331 | 36,558 |
| 10% | 9.9% | 18,166 | 17,967 |
| Active Idle | 0 | 0 | |
| Target Load | Actual Load | ssj_ops | |
|---|---|---|---|
| Target | Actual | ||
| Calibration 1 | 180,065 | ||
| Calibration 2 | 184,330 | ||
| Calibration 3 | 183,956 | ||
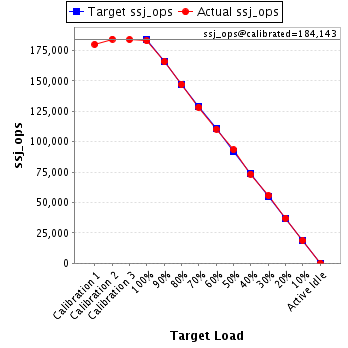
| ssj_ops@calibrated=184,143 | |||
| 100% | 99.3% | 184,143 | 182,918 |
| 90% | 90.1% | 165,728 | 165,870 |
| 80% | 79.9% | 147,314 | 147,158 |
| 70% | 69.7% | 128,900 | 128,359 |
| 60% | 60.0% | 110,486 | 110,409 |
| 50% | 50.7% | 92,071 | 93,405 |
| 40% | 39.8% | 73,657 | 73,349 |
| 30% | 30.2% | 55,243 | 55,591 |
| 20% | 20.2% | 36,829 | 37,172 |
| 10% | 10.2% | 18,414 | 18,723 |
| Active Idle | 0 | 0 | |
| Target Load | Actual Load | ssj_ops | |
|---|---|---|---|
| Target | Actual | ||
| Calibration 1 | 177,232 | ||
| Calibration 2 | 182,060 | ||
| Calibration 3 | 181,808 | ||
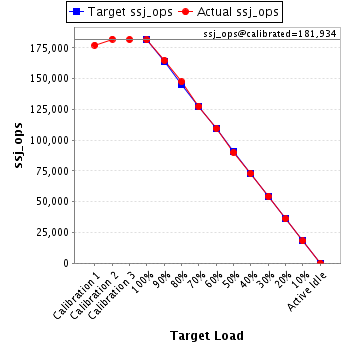
| ssj_ops@calibrated=181,934 | |||
| 100% | 99.7% | 181,934 | 181,413 |
| 90% | 90.6% | 163,741 | 164,904 |
| 80% | 81.0% | 145,547 | 147,329 |
| 70% | 70.0% | 127,354 | 127,431 |
| 60% | 60.2% | 109,161 | 109,549 |
| 50% | 49.4% | 90,967 | 89,942 |
| 40% | 40.1% | 72,774 | 72,896 |
| 30% | 29.9% | 54,580 | 54,320 |
| 20% | 19.8% | 36,387 | 36,016 |
| 10% | 10.0% | 18,193 | 18,110 |
| Active Idle | 0 | 0 | |
| Target Load | Actual Load | ssj_ops | |
|---|---|---|---|
| Target | Actual | ||
| Calibration 1 | 176,643 | ||
| Calibration 2 | 179,501 | ||
| Calibration 3 | 179,665 | ||
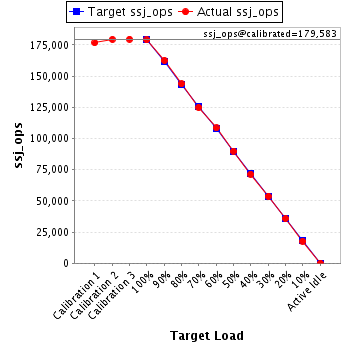
| ssj_ops@calibrated=179,583 | |||
| 100% | 99.7% | 179,583 | 179,023 |
| 90% | 90.6% | 161,625 | 162,669 |
| 80% | 80.0% | 143,666 | 143,748 |
| 70% | 69.5% | 125,708 | 124,859 |
| 60% | 60.4% | 107,750 | 108,457 |
| 50% | 50.1% | 89,792 | 89,973 |
| 40% | 39.8% | 71,833 | 71,442 |
| 30% | 29.9% | 53,875 | 53,760 |
| 20% | 20.0% | 35,917 | 35,835 |
| 10% | 9.9% | 17,958 | 17,704 |
| Active Idle | 0 | 0 | |