
SPECpower_ssj2008
Copyright © 2007-2012 Standard Performance Evaluation Corporation
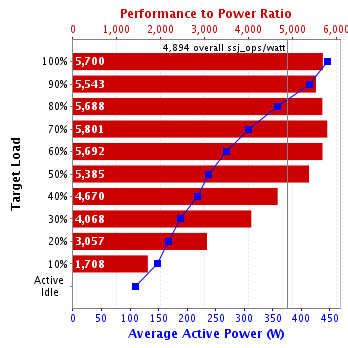
| Dell Inc. PowerEdge R820 (Intel Xeon E5-4650L, 2.60 GHz) | SPECpower_ssj2008 = 4,894 overall ssj_ops/watt | ||||
| Test Sponsor: | Dell Inc. | SPEC License #: | 55 | Test Method: | Single Node |
| Tested By: | Dell Inc. | Test Location: | Round Rock, TX, USA | Test Date: | May 1, 2012 |
| Hardware Availability: | Jun-2012 | Software Availability: | Dec-2011 | Publication: | May 30, 2012 |
| System Source: | Single Supplier | System Designation: | Server | Power Provisioning: | Line-powered |
| Performance | Power | Performance to Power Ratio | ||
|---|---|---|---|---|
| Target Load | Actual Load | ssj_ops | Average Active Power (W) | |
| 100% | 99.7% | 2,540,179 | 446 | 5,700 |
| 90% | 90.1% | 2,296,845 | 414 | 5,543 |
| 80% | 79.8% | 2,034,530 | 358 | 5,688 |
| 70% | 70.0% | 1,782,447 | 307 | 5,801 |
| 60% | 60.0% | 1,527,602 | 268 | 5,692 |
| 50% | 50.1% | 1,275,261 | 237 | 5,385 |
| 40% | 39.9% | 1,017,253 | 218 | 4,670 |
| 30% | 30.0% | 765,170 | 188 | 4,068 |
| 20% | 20.0% | 509,859 | 167 | 3,057 |
| 10% | 10.0% | 253,927 | 149 | 1,708 |
| Active Idle | 0 | 110 | 0 | |
| ∑ssj_ops / ∑power = | 4,894 | |||
| Set Identifier: | sut |
| Set Description: | System Under Test |
| # of Identical Nodes: | 1 |
| Comment: | PowerEdge R820. |
| Hardware | |
|---|---|
| Hardware Vendor: | Dell Inc. |
| Model: | PowerEdge R820 (Intel Xeon E5-4650L, 2.60 GHz) |
| Form Factor: | 2U |
| CPU Name: | Intel Xeon E5-4650L 2.60 GHz |
| CPU Characteristics: | 8 core, 2.60 GHz, 20MB L3 Cache |
| CPU Frequency (MHz): | 2600 |
| CPU(s) Enabled: | 32 cores, 4 chips, 8 cores/chip |
| Hardware Threads: | 64 (2 / core) |
| CPU(s) Orderable: | 1,2,4 chips |
| Primary Cache: | 32 KB I + 32 KB D on chip per core |
| Secondary Cache: | 256 KB I+D on chip per core |
| Tertiary Cache: | 20 MB I+D on chip per chip |
| Other Cache: | None |
| Memory Amount (GB): | 48 |
| # and size of DIMM: | 12 x 4096 MB |
| Memory Details: | 4GB 2Rx8 PC3L-10600E-9 ECC; Slots A1-3,B1-3,C1-3,D1-3 populated. |
| Power Supply Quantity and Rating (W): | 1 x 1100 |
| Power Supply Details: | Dell P/N GYH9V |
| Disk Drive: | 1 x 100GB SATA SSD, Dell P/N DYW42 |
| Disk Controller: | PERC H310, Dell P/N 3P0R3 |
| # and type of Network Interface Cards (NICs) Installed: | 2 x dual-port Broadcom 5720, Dell P/N FM487 |
| NICs Enabled in Firmware / OS / Connected: | 4/4/1 |
| Network Speed (Mbit): | 1000 |
| Keyboard: | None |
| Mouse: | None |
| Monitor: | None |
| Optical Drives: | No |
| Other Hardware: | None |
| Software | |
|---|---|
| Power Management: | Power Saver Mode in OS (see SUT Notes) |
| Operating System (OS): | Microsoft Windows 2008 Enterprise x64 Edition |
| OS Version: | R2 SP1 |
| Filesystem: | NTFS |
| JVM Vendor: | Oracle Corporation |
| JVM Version: | Oracle Java HotSpot(TM) 64-Bit Server VM on Windows, version 1.6.0_30 |
| JVM Command-line Options: | -server -Xmx1024m -Xms1024m -Xmn768m -XX:SurvivorRatio=60 -XX:TargetSurvivorRatio=90 -XX:ParallelGCThreads=2 -XX:AllocatePrefetchDistance=256 -XX:AllocatePrefetchLines=4 -XX:LoopUnrollLimit=45 -XX:InitialTenuringThreshold=12 -XX:MaxTenuringThreshold=15 -XX:InlineSmallCode=3900 -XX:MaxInlineSize=270 -XX:FreqInlineSize=2500 -XX:+UseLargePages -XX:+UseParallelOldGC -XX:+UseCompressedStrings -XX:+AggressiveOpts |
| JVM Affinity: | start /affinity [3,C,30,C0,300,C00,3000,C000,30000,C0000,300000,C00000,3000000,C000000,30000000,C0000000,300000000,C00000000,3000000000,C000000000,30000000000,C0000000000,300000000000,C00000000000,3000000000000,C000000000000,30000000000000,C0000000000000,300000000000000,C00000000000000,3000000000000000,C000000000000000] |
| JVM Instances: | 32 |
| JVM Initial Heap (MB): | 1024 |
| JVM Maximum Heap (MB): | 1024 |
| JVM Address Bits: | 64 |
| Boot Firmware Version: | 1.1.3 |
| Management Firmware Version: | 1.20.20 (build 16) |
| Workload Version: | SSJ 1.2.9 |
| Director Location: | Controller |
| Other Software: | None |
| Hardware | |
|---|---|
| Hardware Vendor: | Dell Inc |
| Model: | Poweredge 1950 |
| CPU Description: | Intel Xeon E5205, 1.86 GHz |
| Memory amount (GB): | 4.0 |
| Software | |
|---|---|
| Operating System (OS): | Microsoft Windows Server 2003 Enterprise Edition Service Pack 2 |
| JVM Vendor: | Oracle Corporation |
| JVM Version: | Hotspot(TM) Client VM, version 1.6.0_27 |
| CCS Version: | 1.2.5 |
| Power Analyzer pwr1 | |
|---|---|
| Hardware Vendor: | Yokogawa |
| Model: | WT210 |
| Serial Number: | 91K308530 |
| Connectivity: | RS-232 |
| Input Connection: | Default |
| Metrology Institute: | NIST |
| Accredited by: | SIMCO |
| Calibration Label: | 5402017 |
| Date of Calibration: | 20-Oct-2011 |
| PTDaemon Host System: | same as CCS |
| PTDaemon Host OS: | same as CCS |
| PTDaemon Version: | 1.4.1-1271fb18-20110728 |
| Setup Description: | Connected to power supply |
| Temperature Sensor temp1 | |
|---|---|
| Hardware Vendor: | Digi International Inc. |
| Model: | Watchport/H |
| Driver Version: | 5.30.02 |
| Connectivity: | USB |
| PTDaemon Host System: | same as CCS |
| PTDaemon Host OS: | same as CCS |
| Setup Description: | 25 mm in front of SUT main airflow intake |
| Target Load | Average Active Power (W) | Minimum Ambient Temperature (°C) |
|---|---|---|
| 100% | 446 | 22.2 |
| 90% | 414 | 22.2 |
| 80% | 358 | 22.2 |
| 70% | 307 | 22.2 |
| 60% | 268 | 22.1 |
| 50% | 237 | 22.1 |
| 40% | 218 | 22.1 |
| 30% | 188 | 22.0 |
| 20% | 167 | 21.9 |
| 10% | 149 | 21.9 |
| Active Idle | 110 | 21.9 |
| Line Standard | Minimum Temperature (°C) | Elevation (m) |
|---|---|---|
| 208V / 60 Hz / 1 phase / 2 wires | 21.9 | 255 |
| Target Load | Actual Load | ssj_ops | |
|---|---|---|---|
| Target | Actual | ||
| Calibration 1 | 2,526,052 | ||
| Calibration 2 | 2,546,423 | ||
| Calibration 3 | 2,549,500 | ||
| ssj_ops@calibrated=2,547,961 | |||
| 100% | 99.7% | 2,547,961 | 2,540,179 |
| 90% | 90.1% | 2,293,165 | 2,296,845 |
| 80% | 79.8% | 2,038,369 | 2,034,530 |
| 70% | 70.0% | 1,783,573 | 1,782,447 |
| 60% | 60.0% | 1,528,777 | 1,527,602 |
| 50% | 50.1% | 1,273,981 | 1,275,261 |
| 40% | 39.9% | 1,019,185 | 1,017,253 |
| 30% | 30.0% | 764,388 | 765,170 |
| 20% | 20.0% | 509,592 | 509,859 |
| 10% | 10.0% | 254,796 | 253,927 |
| Active Idle | 0 | 0 | |
