
SPECpower_ssj2008
Aggregate Performance Report
Copyright © 2007-2011 Standard Performance Evaluation Corporation
| Dell Inc. PowerEdge M915 | ssj_ops@100% = 14,793,524 ssj_ops@100% per Host = 1,849,190 ssj_ops@100% per JVM = 231,149 |
||||
| Test Sponsor: | Dell Inc. | SPEC License #: | 55 | Test Method: | Multi Node |
| Tested By: | Dell Inc. | Test Location: | Round Rock, TX, USA | Test Date: | Jun 28, 2011 |
| Hardware Availability: | Jun-2011 | Software Availability: | Feb-2011 | Publication: | Aug 2, 2011 |
| System Source: | Single Supplier | System Designation: | Server | Power Provisioning: | Line-powered |
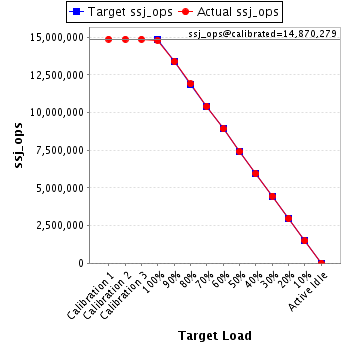
| Target Load | Actual Load | ssj_ops | |
|---|---|---|---|
| Target | Actual | ||
| Calibration 1 | 14,875,914 | ||
| Calibration 2 | 14,869,453 | ||
| Calibration 3 | 14,871,104 | ||
| ssj_ops@calibrated=14,870,279 | |||
| 100% | 99.5% | 14,870,279 | 14,793,524 |
| 90% | 90.1% | 13,383,251 | 13,398,423 |
| 80% | 80.0% | 11,896,223 | 11,901,540 |
| 70% | 70.0% | 10,409,195 | 10,416,122 |
| 60% | 60.0% | 8,922,167 | 8,921,763 |
| 50% | 50.0% | 7,435,139 | 7,437,628 |
| 40% | 40.0% | 5,948,112 | 5,944,683 |
| 30% | 30.0% | 4,461,084 | 4,464,541 |
| 20% | 20.0% | 2,974,056 | 2,967,821 |
| 10% | 10.0% | 1,487,028 | 1,484,822 |
| Active Idle | 0 | 0 | |
| # of Nodes | # of Chips | # of Cores | # of Threads | Total RAM (GB) | # of OS Images | # of JVM Instances |
|---|---|---|---|---|---|---|
| 8 | 32 | 384 | 384 | 256 | 8 | 64 |
| Set Identifier: | sut |
| Set Description: | PowerEdge M915 |
| # of Identical Nodes: | 8 |
| Comment: | None |
| Hardware per Node | |
|---|---|
| Hardware Vendor: | Dell Inc. |
| Model: | PowerEdge M915 |
| Form Factor: | Blade |
| CPU Name: | AMD Opteron 6176 (2.30 GHz) |
| CPU Characteristics: | 12 Core, 2.30 GHz, 12 MB L3 Cache |
| CPU Frequency (MHz): | 2300 |
| CPU(s) Enabled: | 48 cores, 4 chips, 12 cores/chip |
| Hardware Threads: | 48 (1 / core) |
| CPU(s) Orderable: | 2,4 chips |
| Primary Cache: | 64 KB I + 64 KB D on chip per core |
| Secondary Cache: | 512 KB I+D on chip per core |
| Tertiary Cache: | 12 MB I+D on chip per chip, 6MB shared / 6 cores |
| Other Cache: | None |
| Memory Amount (GB): | 32 |
| # and size of DIMM: | 16 x 2048 MB |
| Memory Details: | 2GB 1Rx8 PC3L-10600R ECC RDIMM, Slots A1-A4, B1-B4, C1-C4, D1-D4 populated |
| Power Supply Quantity and Rating (W): | None |
| Power Supply Details: | N/A |
| Disk Drive: | 1 x 50 GB 2.5" SSD P/N X2N7H |
| Disk Controller: | PERC H200 Modular |
| # and type of Network Interface Cards (NICs) Installed: | 2 x onboard dual-port 1 Gigabit Ethernet |
| NICs Enabled in Firmware / OS / Connected: | 2/2/1 |
| Network Speed (Mbit): | 1000 |
| Keyboard: | None |
| Mouse: | None |
| Monitor: | None |
| Optical Drives: | No |
| Other Hardware: | None |
| Software per Node | |
|---|---|
| Power Management: | Balanced Mode in OS (See Notes) |
| Operating System (OS): | Windows 2008 Server Enterprise x64 Edition |
| OS Version: | R2 SP1 |
| Filesystem: | NTFS |
| JVM Vendor: | IBM Corporation |
| JVM Version: | IBM J9 VM (build 2.4, J2RE 1.6.0 IBM J9 2.4 Windows Server 2008 amd64-64 jvmwa64 60sr5-20090519_35743 (JIT enabled, AOT enabled) |
| JVM Command-line Options: | -Xaggressive -Xcompressedrefs -Xgcpolicy:gencon -Xmn1400m -Xms1875m -Xmx1875m -XlockReservation -Xnoloa -XtlhPrefetch -Xlp |
| JVM Affinity: | start /affinity [3F, FC0, 3F000, FC0000, 3F000000, FC0000000, 3F000000000, FC0000000000] |
| JVM Instances: | 8 |
| JVM Initial Heap (MB): | 1875 |
| JVM Maximum Heap (MB): | 1875 |
| JVM Address Bits: | 64 |
| Boot Firmware Version: | 1.0.3 |
| Management Firmware Version: | iDRAC 3.21 build 48 |
| Workload Version: | SSJ 1.2.6 |
| Director Location: | Controller |
| Other Software: | IBM WebSphere Application Server |
| Host | ssj_ops@100% |
|---|---|
| M915-2 | 1,856,497 |
| m915-1 | 1,839,520 |
| m915-3 | 1,853,344 |
| m915-4 | 1,837,949 |
| m915-5 | 1,843,342 |
| m915-6 | 1,859,882 |
| m915-7 | 1,853,310 |
| m915-8 | 1,849,680 |
| ssj_ops@100% | 14,793,524 |
| ssj_ops@100% per Host | 1,849,190 |
| ssj_ops@100% per JVM | 231,149 |

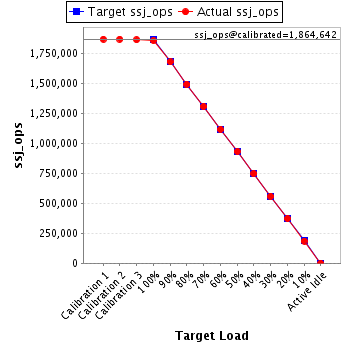
| Target Load | Actual Load | ssj_ops | |
|---|---|---|---|
| Target | Actual | ||
| Calibration 1 | 1,867,641 | ||
| Calibration 2 | 1,867,745 | ||
| Calibration 3 | 1,861,539 | ||
| ssj_ops@calibrated=1,864,642 | |||
| 100% | 99.6% | 1,864,642 | 1,856,497 |
| 90% | 90.0% | 1,678,178 | 1,678,460 |
| 80% | 80.0% | 1,491,714 | 1,492,140 |
| 70% | 70.1% | 1,305,250 | 1,307,251 |
| 60% | 59.9% | 1,118,785 | 1,116,517 |
| 50% | 49.9% | 932,321 | 931,360 |
| 40% | 40.0% | 745,857 | 745,938 |
| 30% | 30.0% | 559,393 | 558,831 |
| 20% | 19.9% | 372,928 | 371,954 |
| 10% | 9.9% | 186,464 | 185,331 |
| Active Idle | 0 | 0 | |
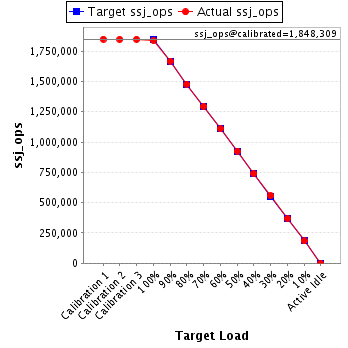
| Target Load | Actual Load | ssj_ops | |
|---|---|---|---|
| Target | Actual | ||
| Calibration 1 | 1,849,488 | ||
| Calibration 2 | 1,847,854 | ||
| Calibration 3 | 1,848,764 | ||
| ssj_ops@calibrated=1,848,309 | |||
| 100% | 99.5% | 1,848,309 | 1,839,520 |
| 90% | 90.3% | 1,663,478 | 1,668,864 |
| 80% | 80.0% | 1,478,647 | 1,477,939 |
| 70% | 70.1% | 1,293,817 | 1,295,139 |
| 60% | 60.0% | 1,108,986 | 1,108,997 |
| 50% | 50.1% | 924,155 | 926,104 |
| 40% | 40.0% | 739,324 | 739,029 |
| 30% | 30.1% | 554,493 | 555,782 |
| 20% | 19.9% | 369,662 | 368,286 |
| 10% | 10.0% | 184,831 | 184,077 |
| Active Idle | 0 | 0 | |
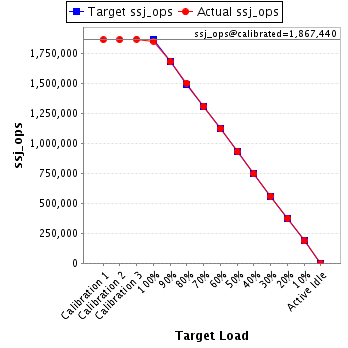
| Target Load | Actual Load | ssj_ops | |
|---|---|---|---|
| Target | Actual | ||
| Calibration 1 | 1,864,577 | ||
| Calibration 2 | 1,865,737 | ||
| Calibration 3 | 1,869,143 | ||
| ssj_ops@calibrated=1,867,440 | |||
| 100% | 99.2% | 1,867,440 | 1,853,344 |
| 90% | 90.0% | 1,680,696 | 1,680,629 |
| 80% | 80.5% | 1,493,952 | 1,502,659 |
| 70% | 70.1% | 1,307,208 | 1,308,633 |
| 60% | 60.1% | 1,120,464 | 1,122,263 |
| 50% | 49.9% | 933,720 | 931,709 |
| 40% | 39.9% | 746,976 | 745,077 |
| 30% | 30.0% | 560,232 | 559,464 |
| 20% | 20.1% | 373,488 | 374,435 |
| 10% | 10.0% | 186,744 | 186,694 |
| Active Idle | 0 | 0 | |
| Target Load | Actual Load | ssj_ops | |
|---|---|---|---|
| Target | Actual | ||
| Calibration 1 | 1,849,801 | ||
| Calibration 2 | 1,850,614 | ||
| Calibration 3 | 1,847,870 | ||
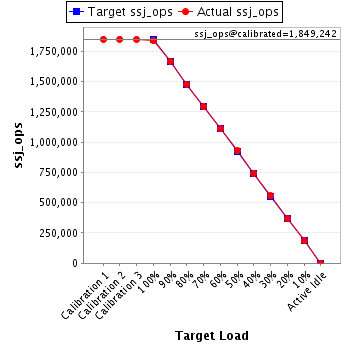
| ssj_ops@calibrated=1,849,242 | |||
| 100% | 99.4% | 1,849,242 | 1,837,949 |
| 90% | 90.2% | 1,664,318 | 1,667,809 |
| 80% | 80.0% | 1,479,393 | 1,478,794 |
| 70% | 69.9% | 1,294,469 | 1,292,581 |
| 60% | 60.1% | 1,109,545 | 1,111,287 |
| 50% | 50.2% | 924,621 | 927,870 |
| 40% | 40.3% | 739,697 | 744,320 |
| 30% | 30.0% | 554,773 | 555,505 |
| 20% | 19.9% | 369,848 | 367,475 |
| 10% | 10.0% | 184,924 | 184,703 |
| Active Idle | 0 | 0 | |
| Target Load | Actual Load | ssj_ops | |
|---|---|---|---|
| Target | Actual | ||
| Calibration 1 | 1,852,239 | ||
| Calibration 2 | 1,850,954 | ||
| Calibration 3 | 1,853,108 | ||
| ssj_ops@calibrated=1,852,031 | |||
| 100% | 99.5% | 1,852,031 | 1,843,342 |
| 90% | 90.1% | 1,666,828 | 1,668,090 |
| 80% | 80.1% | 1,481,625 | 1,482,866 |
| 70% | 70.2% | 1,296,422 | 1,299,673 |
| 60% | 59.7% | 1,111,219 | 1,105,767 |
| 50% | 50.1% | 926,015 | 926,982 |
| 40% | 39.9% | 740,812 | 739,488 |
| 30% | 29.9% | 555,609 | 554,326 |
| 20% | 19.9% | 370,406 | 368,936 |
| 10% | 10.0% | 185,203 | 184,337 |
| Active Idle | 0 | 0 | |

| Target Load | Actual Load | ssj_ops | |
|---|---|---|---|
| Target | Actual | ||
| Calibration 1 | 1,868,868 | ||
| Calibration 2 | 1,870,999 | ||
| Calibration 3 | 1,868,574 | ||
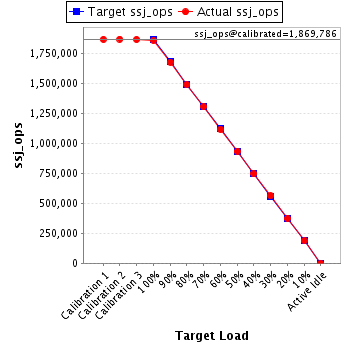
| ssj_ops@calibrated=1,869,786 | |||
| 100% | 99.5% | 1,869,786 | 1,859,882 |
| 90% | 89.8% | 1,682,808 | 1,679,623 |
| 80% | 79.8% | 1,495,829 | 1,491,749 |
| 70% | 69.9% | 1,308,850 | 1,306,749 |
| 60% | 59.9% | 1,121,872 | 1,120,376 |
| 50% | 49.9% | 934,893 | 933,905 |
| 40% | 39.9% | 747,914 | 746,674 |
| 30% | 30.1% | 560,936 | 561,921 |
| 20% | 20.0% | 373,957 | 373,582 |
| 10% | 10.0% | 186,979 | 187,575 |
| Active Idle | 0 | 0 | |
| Target Load | Actual Load | ssj_ops | |
|---|---|---|---|
| Target | Actual | ||
| Calibration 1 | 1,860,243 | ||
| Calibration 2 | 1,859,864 | ||
| Calibration 3 | 1,859,992 | ||
| ssj_ops@calibrated=1,859,928 | |||
| 100% | 99.6% | 1,859,928 | 1,853,310 |
| 90% | 89.9% | 1,673,936 | 1,672,433 |
| 80% | 80.0% | 1,487,943 | 1,488,022 |
| 70% | 70.2% | 1,301,950 | 1,304,803 |
| 60% | 60.4% | 1,115,957 | 1,122,722 |
| 50% | 50.0% | 929,964 | 930,884 |
| 40% | 39.9% | 743,971 | 741,590 |
| 30% | 30.1% | 557,979 | 560,172 |
| 20% | 20.0% | 371,986 | 372,581 |
| 10% | 10.1% | 185,993 | 187,005 |
| Active Idle | 0 | 0 | |

| Target Load | Actual Load | ssj_ops | |
|---|---|---|---|
| Target | Actual | ||
| Calibration 1 | 1,863,056 | ||
| Calibration 2 | 1,855,685 | ||
| Calibration 3 | 1,862,114 | ||
| ssj_ops@calibrated=1,858,900 | |||
| 100% | 99.5% | 1,858,900 | 1,849,680 |
| 90% | 90.5% | 1,673,010 | 1,682,514 |
| 80% | 80.0% | 1,487,120 | 1,487,373 |
| 70% | 70.0% | 1,301,230 | 1,301,293 |
| 60% | 59.9% | 1,115,340 | 1,113,835 |
| 50% | 50.0% | 929,450 | 928,815 |
| 40% | 39.9% | 743,560 | 742,567 |
| 30% | 30.0% | 557,670 | 558,540 |
| 20% | 19.9% | 371,780 | 370,574 |
| 10% | 10.0% | 185,890 | 185,100 |
| Active Idle | 0 | 0 | |
