SPECpower_ssj2008
Host 'WIN-ULK8O9BFFGJ' Performance Report
Copyright © 2007-2011 Standard Performance Evaluation Corporation
| Acer Incorporated Acer AW2000h-AW170h F1 | ssj_ops@100% = 933,223 ssj_ops@100% per JVM = 155,537 |
||||
| Test Sponsor: | Acer Incorporated | SPEC License #: | 97 | Test Method: | Multi Node |
| Tested By: | Acer Incorporated | Test Location: | Taipei, R.O.C. | Test Date: | Mar 8, 2011 |
| Hardware Availability: | Feb-2011 | Software Availability: | Dec-2009 | Publication: | Apr 7, 2011 |
| System Source: | Single Supplier | System Designation: | Server | Power Provisioning: | Line-powered |
| Target Load | Actual Load | ssj_ops | |
|---|---|---|---|
| Target | Actual | ||
| Calibration 1 | 934,437 | ||
| Calibration 2 | 937,631 | ||
| Calibration 3 | 935,470 | ||
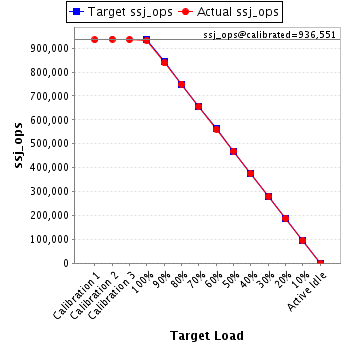
| ssj_ops@calibrated=936,551 | |||
| 100% | 99.6% | 936,551 | 933,223 |
| 90% | 89.5% | 842,895 | 838,639 |
| 80% | 80.0% | 749,240 | 749,352 |
| 70% | 70.0% | 655,585 | 655,327 |
| 60% | 60.0% | 561,930 | 561,604 |
| 50% | 50.1% | 468,275 | 469,616 |
| 40% | 40.1% | 374,620 | 375,353 |
| 30% | 29.9% | 280,965 | 280,037 |
| 20% | 20.1% | 187,310 | 187,954 |
| 10% | 10.1% | 93,655 | 94,762 |
| Active Idle | 0 | 0 | |
| Set Identifier: | sut |
| Set Description: | System Under Test |
| # of Identical Nodes: | 4 |
| Comment: | None |
| Hardware | |
|---|---|
| Hardware Vendor: | Acer Incorporated |
| Model: | Acer AW2000h-AW170h F1 |
| Form Factor: | 2U |
| CPU Name: | Intel Xeon X5675 |
| CPU Characteristics: | Six-Core, 3.07 GHz, 12 MB L3 cache |
| CPU Frequency (MHz): | 3067 |
| CPU(s) Enabled: | 12 cores, 2 chips, 6 cores/chip |
| Hardware Threads: | 24 (2 / core) |
| CPU(s) Orderable: | 1,2 chips |
| Primary Cache: | 32 KB I + 32 KB D on chip per core |
| Secondary Cache: | 256 KB I+D on chip per core |
| Tertiary Cache: | 12 MB I+D on chip per chip |
| Other Cache: | None |
| Memory Amount (GB): | 24 |
| # and size of DIMM: | 6 x 4096 MB |
| Memory Details: | 4GB 2Rx8 PC3-10600E; slots 1A, 2A, and 3A populated on each processor |
| Power Supply Quantity and Rating (W): | None |
| Power Supply Details: | Shared |
| Disk Drive: | 1 x 500GB SATA 3.5" HDD, Acer part #KH.500W8.019 |
| Disk Controller: | Integrated SATA controller |
| # and type of Network Interface Cards (NICs) Installed: | 2 x Intel 82576 Gigabit Ethernet |
| NICs Enabled in Firmware / OS / Connected: | 2/2/1 |
| Network Speed (Mbit): | 1000 |
| Keyboard: | USB |
| Mouse: | USB |
| Monitor: | Direct |
| Optical Drives: | No |
| Other Hardware: | None |
| Software | |
|---|---|
| Power Management: | Power save enabled in OS |
| Operating System (OS): | Windows Server 2008, Enterprise Edition |
| OS Version: | R2 |
| Filesystem: | NTFS |
| JVM Vendor: | IBM Corporation |
| JVM Version: | IBM J9 VM (build 2.4, JRE 1.6.0 IBM J9 2.4 Windows Server 2008 amd64-64 jvmwa6460sr7-20091214_49398 (JIT enabled, AOT enabled) |
| JVM Command-line Options: | -Xmn1550m -Xms1950m -Xmx1950m -Xaggressive -Xcompressedrefs -Xgcpolicy:gencon -XlockReservation -Xnoloa -XtlhPrefetch -Xlp |
| JVM Affinity: | start /affinity [0xF, 0xF0, 0xF00,0xF000, 0xF0000, 0xF00000] |
| JVM Instances: | 6 |
| JVM Initial Heap (MB): | 1950 |
| JVM Maximum Heap (MB): | 1950 |
| JVM Address Bits: | 64 |
| Boot Firmware Version: | P08 |
| Management Firmware Version: | 1.20 |
| Workload Version: | SSJ 1.2.6 |
| Director Location: | Controller |
| Other Software: | None |
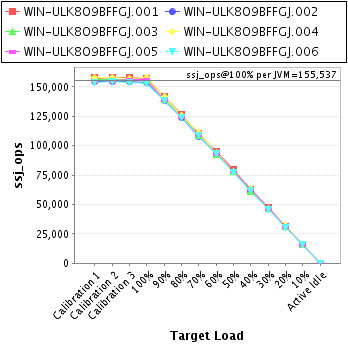
| JVM Instance | ssj_ops@100% |
|---|---|
| WIN-ULK8O9BFFGJ.001 | 156,879 |
| WIN-ULK8O9BFFGJ.002 | 154,077 |
| WIN-ULK8O9BFFGJ.003 | 155,722 |
| WIN-ULK8O9BFFGJ.004 | 157,708 |
| WIN-ULK8O9BFFGJ.005 | 155,866 |
| WIN-ULK8O9BFFGJ.006 | 152,973 |
| ssj_ops@100% | 933,223 |
| ssj_ops@100% per JVM | 155,537 |
| Target Load | Actual Load | ssj_ops | |
|---|---|---|---|
| Target | Actual | ||
| Calibration 1 | 157,531 | ||
| Calibration 2 | 158,218 | ||
| Calibration 3 | 158,116 | ||
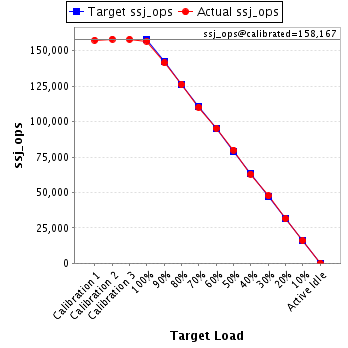
| ssj_ops@calibrated=158,167 | |||
| 100% | 99.2% | 158,167 | 156,879 |
| 90% | 89.5% | 142,350 | 141,535 |
| 80% | 79.9% | 126,533 | 126,307 |
| 70% | 69.7% | 110,717 | 110,206 |
| 60% | 60.3% | 94,900 | 95,366 |
| 50% | 50.5% | 79,083 | 79,946 |
| 40% | 39.8% | 63,267 | 62,959 |
| 30% | 30.1% | 47,450 | 47,566 |
| 20% | 19.9% | 31,633 | 31,480 |
| 10% | 10.1% | 15,817 | 16,049 |
| Active Idle | 0 | 0 | |
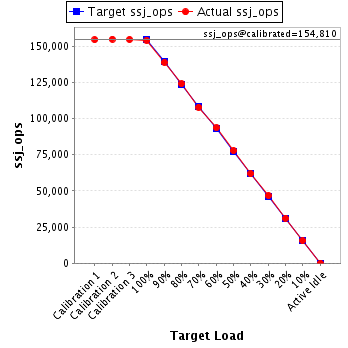
| Target Load | Actual Load | ssj_ops | |
|---|---|---|---|
| Target | Actual | ||
| Calibration 1 | 154,488 | ||
| Calibration 2 | 154,906 | ||
| Calibration 3 | 154,715 | ||
| ssj_ops@calibrated=154,810 | |||
| 100% | 99.5% | 154,810 | 154,077 |
| 90% | 89.7% | 139,329 | 138,823 |
| 80% | 80.1% | 123,848 | 124,003 |
| 70% | 69.7% | 108,367 | 107,877 |
| 60% | 60.5% | 92,886 | 93,700 |
| 50% | 50.3% | 77,405 | 77,842 |
| 40% | 40.0% | 61,924 | 61,868 |
| 30% | 30.2% | 46,443 | 46,784 |
| 20% | 20.1% | 30,962 | 31,181 |
| 10% | 10.1% | 15,481 | 15,678 |
| Active Idle | 0 | 0 | |
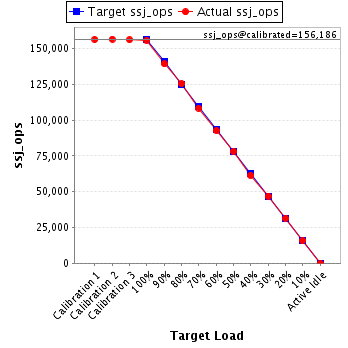
| Target Load | Actual Load | ssj_ops | |
|---|---|---|---|
| Target | Actual | ||
| Calibration 1 | 156,247 | ||
| Calibration 2 | 156,436 | ||
| Calibration 3 | 155,936 | ||
| ssj_ops@calibrated=156,186 | |||
| 100% | 99.7% | 156,186 | 155,722 |
| 90% | 89.1% | 140,567 | 139,183 |
| 80% | 80.3% | 124,948 | 125,390 |
| 70% | 69.3% | 109,330 | 108,287 |
| 60% | 59.3% | 93,711 | 92,596 |
| 50% | 50.1% | 78,093 | 78,206 |
| 40% | 39.3% | 62,474 | 61,345 |
| 30% | 30.0% | 46,856 | 46,888 |
| 20% | 20.1% | 31,237 | 31,401 |
| 10% | 10.1% | 15,619 | 15,749 |
| Active Idle | 0 | 0 | |
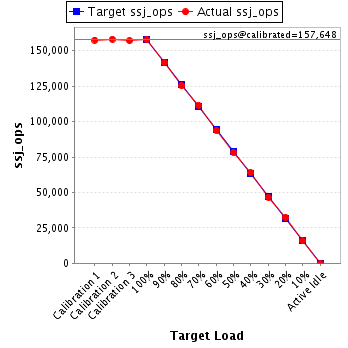
| Target Load | Actual Load | ssj_ops | |
|---|---|---|---|
| Target | Actual | ||
| Calibration 1 | 157,592 | ||
| Calibration 2 | 158,190 | ||
| Calibration 3 | 157,106 | ||
| ssj_ops@calibrated=157,648 | |||
| 100% | 100.0% | 157,648 | 157,708 |
| 90% | 89.8% | 141,883 | 141,549 |
| 80% | 79.5% | 126,118 | 125,286 |
| 70% | 70.7% | 110,354 | 111,464 |
| 60% | 59.6% | 94,589 | 93,895 |
| 50% | 49.7% | 78,824 | 78,278 |
| 40% | 40.5% | 63,059 | 63,914 |
| 30% | 29.7% | 47,294 | 46,758 |
| 20% | 20.5% | 31,530 | 32,338 |
| 10% | 10.0% | 15,765 | 15,737 |
| Active Idle | 0 | 0 | |
| Target Load | Actual Load | ssj_ops | |
|---|---|---|---|
| Target | Actual | ||
| Calibration 1 | 154,983 | ||
| Calibration 2 | 155,286 | ||
| Calibration 3 | 156,076 | ||
| ssj_ops@calibrated=155,681 | |||
| 100% | 100.1% | 155,681 | 155,866 |
| 90% | 89.1% | 140,113 | 138,755 |
| 80% | 79.9% | 124,545 | 124,346 |
| 70% | 69.8% | 108,977 | 108,722 |
| 60% | 59.7% | 93,409 | 92,997 |
| 50% | 50.2% | 77,841 | 78,197 |
| 40% | 40.7% | 62,273 | 63,299 |
| 30% | 29.7% | 46,704 | 46,168 |
| 20% | 19.8% | 31,136 | 30,869 |
| 10% | 10.2% | 15,568 | 15,841 |
| Active Idle | 0 | 0 | |

| Target Load | Actual Load | ssj_ops | |
|---|---|---|---|
| Target | Actual | ||
| Calibration 1 | 153,596 | ||
| Calibration 2 | 154,597 | ||
| Calibration 3 | 153,520 | ||
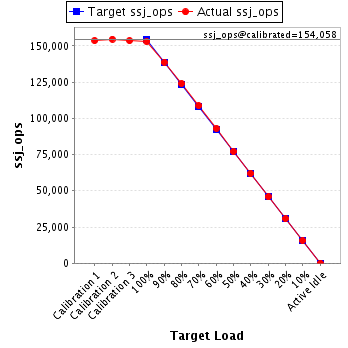
| ssj_ops@calibrated=154,058 | |||
| 100% | 99.3% | 154,058 | 152,973 |
| 90% | 90.1% | 138,653 | 138,794 |
| 80% | 80.5% | 123,247 | 124,020 |
| 70% | 70.6% | 107,841 | 108,770 |
| 60% | 60.4% | 92,435 | 93,050 |
| 50% | 50.1% | 77,029 | 77,147 |
| 40% | 40.2% | 61,623 | 61,969 |
| 30% | 29.8% | 46,218 | 45,873 |
| 20% | 19.9% | 30,812 | 30,685 |
| 10% | 10.2% | 15,406 | 15,708 |
| Active Idle | 0 | 0 | |