SPECpower_ssj2008
Host 'WIN-TDM3C83C35P' Performance Report
Copyright © 2007-2011 Standard Performance Evaluation Corporation
| Acer Incorporated Acer AW2000h-AW170h F1 | ssj_ops@100% = 925,700 ssj_ops@100% per JVM = 154,283 |
||||
| Test Sponsor: | Acer Incorporated | SPEC License #: | 97 | Test Method: | Multi Node |
| Tested By: | Acer Incorporated | Test Location: | Taipei, R.O.C. | Test Date: | Mar 8, 2011 |
| Hardware Availability: | Feb-2011 | Software Availability: | Dec-2009 | Publication: | Apr 7, 2011 |
| System Source: | Single Supplier | System Designation: | Server | Power Provisioning: | Line-powered |
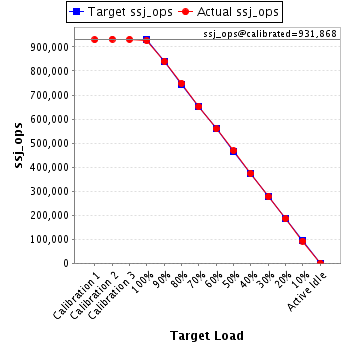
| Target Load | Actual Load | ssj_ops | |
|---|---|---|---|
| Target | Actual | ||
| Calibration 1 | 929,821 | ||
| Calibration 2 | 932,275 | ||
| Calibration 3 | 931,461 | ||
| ssj_ops@calibrated=931,868 | |||
| 100% | 99.3% | 931,868 | 925,700 |
| 90% | 90.1% | 838,681 | 839,942 |
| 80% | 80.3% | 745,495 | 748,677 |
| 70% | 69.9% | 652,308 | 651,695 |
| 60% | 60.0% | 559,121 | 559,211 |
| 50% | 50.2% | 465,934 | 468,253 |
| 40% | 40.1% | 372,747 | 373,588 |
| 30% | 29.8% | 279,560 | 277,325 |
| 20% | 19.9% | 186,374 | 185,346 |
| 10% | 9.9% | 93,187 | 92,517 |
| Active Idle | 0 | 0 | |
| Set Identifier: | sut |
| Set Description: | System Under Test |
| # of Identical Nodes: | 4 |
| Comment: | None |
| Hardware | |
|---|---|
| Hardware Vendor: | Acer Incorporated |
| Model: | Acer AW2000h-AW170h F1 |
| Form Factor: | 2U |
| CPU Name: | Intel Xeon X5675 |
| CPU Characteristics: | Six-Core, 3.07 GHz, 12 MB L3 cache |
| CPU Frequency (MHz): | 3067 |
| CPU(s) Enabled: | 12 cores, 2 chips, 6 cores/chip |
| Hardware Threads: | 24 (2 / core) |
| CPU(s) Orderable: | 1,2 chips |
| Primary Cache: | 32 KB I + 32 KB D on chip per core |
| Secondary Cache: | 256 KB I+D on chip per core |
| Tertiary Cache: | 12 MB I+D on chip per chip |
| Other Cache: | None |
| Memory Amount (GB): | 24 |
| # and size of DIMM: | 6 x 4096 MB |
| Memory Details: | 4GB 2Rx8 PC3-10600E; slots 1A, 2A, and 3A populated on each processor |
| Power Supply Quantity and Rating (W): | None |
| Power Supply Details: | Shared |
| Disk Drive: | 1 x 500GB SATA 3.5" HDD, Acer part #KH.500W8.019 |
| Disk Controller: | Integrated SATA controller |
| # and type of Network Interface Cards (NICs) Installed: | 2 x Intel 82576 Gigabit Ethernet |
| NICs Enabled in Firmware / OS / Connected: | 2/2/1 |
| Network Speed (Mbit): | 1000 |
| Keyboard: | USB |
| Mouse: | USB |
| Monitor: | Direct |
| Optical Drives: | No |
| Other Hardware: | None |
| Software | |
|---|---|
| Power Management: | Power save enabled in OS |
| Operating System (OS): | Windows Server 2008, Enterprise Edition |
| OS Version: | R2 |
| Filesystem: | NTFS |
| JVM Vendor: | IBM Corporation |
| JVM Version: | IBM J9 VM (build 2.4, JRE 1.6.0 IBM J9 2.4 Windows Server 2008 amd64-64 jvmwa6460sr7-20091214_49398 (JIT enabled, AOT enabled) |
| JVM Command-line Options: | -Xmn1550m -Xms1950m -Xmx1950m -Xaggressive -Xcompressedrefs -Xgcpolicy:gencon -XlockReservation -Xnoloa -XtlhPrefetch -Xlp |
| JVM Affinity: | start /affinity [0xF, 0xF0, 0xF00,0xF000, 0xF0000, 0xF00000] |
| JVM Instances: | 6 |
| JVM Initial Heap (MB): | 1950 |
| JVM Maximum Heap (MB): | 1950 |
| JVM Address Bits: | 64 |
| Boot Firmware Version: | P08 |
| Management Firmware Version: | 1.20 |
| Workload Version: | SSJ 1.2.6 |
| Director Location: | Controller |
| Other Software: | None |
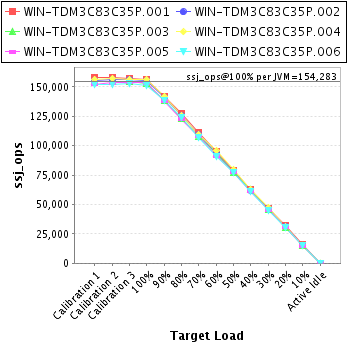
| JVM Instance | ssj_ops@100% |
|---|---|
| WIN-TDM3C83C35P.001 | 156,215 |
| WIN-TDM3C83C35P.002 | 155,146 |
| WIN-TDM3C83C35P.003 | 153,080 |
| WIN-TDM3C83C35P.004 | 156,343 |
| WIN-TDM3C83C35P.005 | 153,455 |
| WIN-TDM3C83C35P.006 | 151,460 |
| ssj_ops@100% | 925,700 |
| ssj_ops@100% per JVM | 154,283 |
| Target Load | Actual Load | ssj_ops | |
|---|---|---|---|
| Target | Actual | ||
| Calibration 1 | 157,930 | ||
| Calibration 2 | 158,291 | ||
| Calibration 3 | 157,160 | ||
| ssj_ops@calibrated=157,726 | |||
| 100% | 99.0% | 157,726 | 156,215 |
| 90% | 90.2% | 141,953 | 142,213 |
| 80% | 80.9% | 126,181 | 127,588 |
| 70% | 70.3% | 110,408 | 110,857 |
| 60% | 60.0% | 94,635 | 94,691 |
| 50% | 50.2% | 78,863 | 79,213 |
| 40% | 40.0% | 63,090 | 63,168 |
| 30% | 29.7% | 47,318 | 46,770 |
| 20% | 20.1% | 31,545 | 31,766 |
| 10% | 10.0% | 15,773 | 15,771 |
| Active Idle | 0 | 0 | |
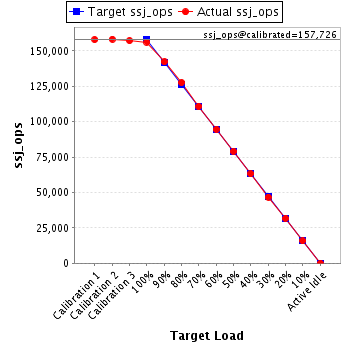
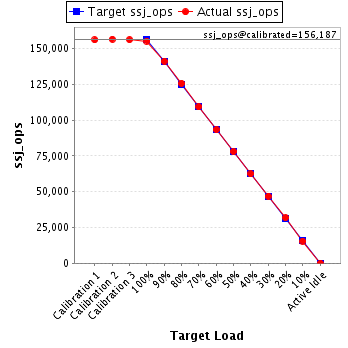
| Target Load | Actual Load | ssj_ops | |
|---|---|---|---|
| Target | Actual | ||
| Calibration 1 | 155,874 | ||
| Calibration 2 | 156,437 | ||
| Calibration 3 | 155,938 | ||
| ssj_ops@calibrated=156,187 | |||
| 100% | 99.3% | 156,187 | 155,146 |
| 90% | 90.4% | 140,569 | 141,117 |
| 80% | 80.5% | 124,950 | 125,659 |
| 70% | 69.9% | 109,331 | 109,158 |
| 60% | 59.7% | 93,712 | 93,298 |
| 50% | 50.0% | 78,094 | 78,106 |
| 40% | 39.9% | 62,475 | 62,315 |
| 30% | 30.0% | 46,856 | 46,854 |
| 20% | 20.3% | 31,237 | 31,698 |
| 10% | 9.9% | 15,619 | 15,508 |
| Active Idle | 0 | 0 | |
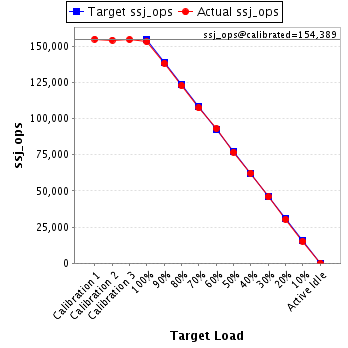
| Target Load | Actual Load | ssj_ops | |
|---|---|---|---|
| Target | Actual | ||
| Calibration 1 | 154,906 | ||
| Calibration 2 | 154,229 | ||
| Calibration 3 | 154,549 | ||
| ssj_ops@calibrated=154,389 | |||
| 100% | 99.2% | 154,389 | 153,080 |
| 90% | 89.5% | 138,950 | 138,174 |
| 80% | 79.5% | 123,511 | 122,728 |
| 70% | 69.6% | 108,072 | 107,421 |
| 60% | 60.4% | 92,633 | 93,190 |
| 50% | 49.7% | 77,195 | 76,790 |
| 40% | 40.4% | 61,756 | 62,345 |
| 30% | 29.7% | 46,317 | 45,859 |
| 20% | 19.6% | 30,878 | 30,337 |
| 10% | 9.9% | 15,439 | 15,255 |
| Active Idle | 0 | 0 | |
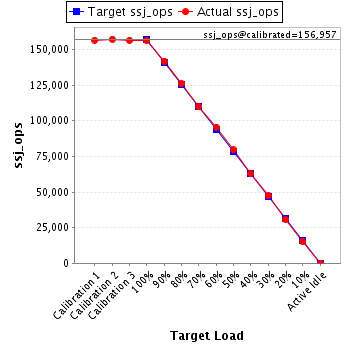
| Target Load | Actual Load | ssj_ops | |
|---|---|---|---|
| Target | Actual | ||
| Calibration 1 | 156,636 | ||
| Calibration 2 | 157,312 | ||
| Calibration 3 | 156,602 | ||
| ssj_ops@calibrated=156,957 | |||
| 100% | 99.6% | 156,957 | 156,343 |
| 90% | 90.4% | 141,261 | 141,951 |
| 80% | 80.3% | 125,566 | 126,040 |
| 70% | 69.9% | 109,870 | 109,747 |
| 60% | 60.9% | 94,174 | 95,651 |
| 50% | 50.7% | 78,479 | 79,551 |
| 40% | 40.2% | 62,783 | 63,070 |
| 30% | 30.1% | 47,087 | 47,303 |
| 20% | 19.7% | 31,391 | 30,862 |
| 10% | 9.9% | 15,696 | 15,499 |
| Active Idle | 0 | 0 | |
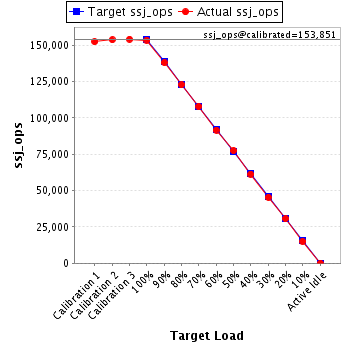
| Target Load | Actual Load | ssj_ops | |
|---|---|---|---|
| Target | Actual | ||
| Calibration 1 | 152,358 | ||
| Calibration 2 | 153,599 | ||
| Calibration 3 | 154,102 | ||
| ssj_ops@calibrated=153,851 | |||
| 100% | 99.7% | 153,851 | 153,455 |
| 90% | 89.7% | 138,466 | 137,985 |
| 80% | 79.8% | 123,081 | 122,711 |
| 70% | 70.1% | 107,696 | 107,842 |
| 60% | 59.6% | 92,310 | 91,629 |
| 50% | 50.3% | 76,925 | 77,460 |
| 40% | 39.9% | 61,540 | 61,360 |
| 30% | 29.5% | 46,155 | 45,358 |
| 20% | 19.9% | 30,770 | 30,637 |
| 10% | 9.8% | 15,385 | 15,035 |
| Active Idle | 0 | 0 | |
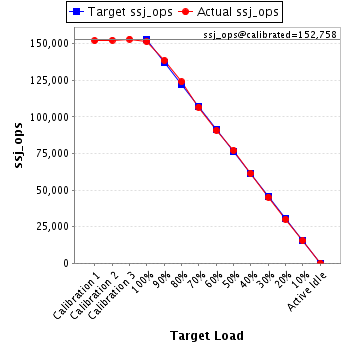
| Target Load | Actual Load | ssj_ops | |
|---|---|---|---|
| Target | Actual | ||
| Calibration 1 | 152,117 | ||
| Calibration 2 | 152,406 | ||
| Calibration 3 | 153,110 | ||
| ssj_ops@calibrated=152,758 | |||
| 100% | 99.2% | 152,758 | 151,460 |
| 90% | 90.7% | 137,482 | 138,502 |
| 80% | 81.1% | 122,206 | 123,950 |
| 70% | 69.8% | 106,931 | 106,669 |
| 60% | 59.4% | 91,655 | 90,753 |
| 50% | 50.5% | 76,379 | 77,134 |
| 40% | 40.1% | 61,103 | 61,331 |
| 30% | 29.6% | 45,827 | 45,181 |
| 20% | 19.7% | 30,552 | 30,044 |
| 10% | 10.1% | 15,276 | 15,450 |
| Active Idle | 0 | 0 | |