SPECpower_ssj2008
Host 'T6000-1' Performance Report
Copyright © 2007-2011 Standard Performance Evaluation Corporation
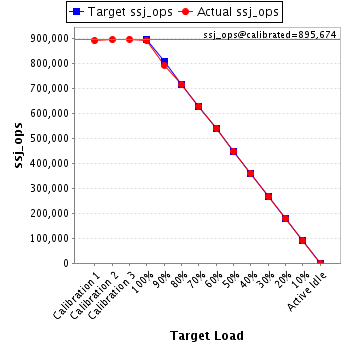
| Huawei Technologies Co., Ltd XH620 | ssj_ops@100% = 890,533 ssj_ops@100% per JVM = 148,422 |
||||
| Test Sponsor: | Huawei Technologies Co., Ltd | SPEC License #: | 3175 | Test Method: | Multi Node |
| Tested By: | Huawei Technologies Co., Ltd | Test Location: | Shenzhen, Guangdong, China | Test Date: | Feb 11, 2011 |
| Hardware Availability: | Dec-2010 | Software Availability: | Dec-2010 | Publication: | Mar 9, 2011 |
| System Source: | Single Supplier | System Designation: | Server | Power Provisioning: | Line-powered |
| Target Load | Actual Load | ssj_ops | |
|---|---|---|---|
| Target | Actual | ||
| Calibration 1 | 890,593 | ||
| Calibration 2 | 894,555 | ||
| Calibration 3 | 896,792 | ||
| ssj_ops@calibrated=895,674 | |||
| 100% | 99.4% | 895,674 | 890,533 |
| 90% | 88.5% | 806,106 | 792,336 |
| 80% | 79.8% | 716,539 | 714,699 |
| 70% | 70.1% | 626,972 | 628,106 |
| 60% | 60.4% | 537,404 | 540,986 |
| 50% | 50.1% | 447,837 | 448,961 |
| 40% | 40.1% | 358,270 | 359,530 |
| 30% | 29.8% | 268,702 | 266,588 |
| 20% | 20.0% | 179,135 | 179,178 |
| 10% | 10.1% | 89,567 | 90,152 |
| Active Idle | 0 | 0 | |
| Set Identifier: | sut |
| Set Description: | System Under Test |
| # of Identical Nodes: | 2 |
| Comment: | None |
| Hardware | |
|---|---|
| Hardware Vendor: | Huawei Technologies Co., Ltd |
| Model: | XH620 |
| Form Factor: | 1U |
| CPU Name: | Intel Xeon X5670 |
| CPU Characteristics: | Six-Core, 2.93GHz, 12MB L3 Cache |
| CPU Frequency (MHz): | 2930 |
| CPU(s) Enabled: | 12 cores, 2 chips, 6 cores/chip |
| Hardware Threads: | 24 (2 / core) |
| CPU(s) Orderable: | 2 chips |
| Primary Cache: | 32 KB I + 32 KB D on chip per core |
| Secondary Cache: | 256 KB I+D on chip per core |
| Tertiary Cache: | 12 MB I+D on chip per chip |
| Other Cache: | None |
| Memory Amount (GB): | 12 |
| # and size of DIMM: | 6 x 2 GB |
| Memory Details: | 2GB 2Rx8 PC3L-10600E ECC |
| Power Supply Quantity and Rating (W): | None |
| Power Supply Details: | Shared |
| Disk Drive: | 1 x 160GB SSD 2.5" SATA |
| Disk Controller: | Integrated SATA controller |
| # and type of Network Interface Cards (NICs) Installed: | 1 x Dual-port BCM 5709 Gigabit Ethernet controller |
| NICs Enabled in Firmware / OS / Connected: | 2/2/1 |
| Network Speed (Mbit): | 1000 |
| Keyboard: | None |
| Mouse: | None |
| Monitor: | None |
| Optical Drives: | No |
| Other Hardware: | None |
| Software | |
|---|---|
| Power Management: | Power Saver enabled in OS |
| Operating System (OS): | Windows Server 2008 R2, Enterprise Edition |
| OS Version: | R2 |
| Filesystem: | NTFS |
| JVM Vendor: | IBM Corporation |
| JVM Version: | IBM J9 VM (build 2.4, JRE 1.6.0 IBM J9 2.4 Windows Server 2008 amd64-64 jvmwa6460sr6-20090923_42924 (JIT enabled, AOT enabled) |
| JVM Command-line Options: | -Xaggressive -Xcompressedrefs -Xgcpolicy:gencon -Xmn1100m -Xms1500m -Xmx1500m -XlockReservation -Xnoloa -XtlhPrefetch -Xlp |
| JVM Affinity: | start /affinity [0xF,0xF0,0xF00,0xF000,0xF0000,0xF00000] |
| JVM Instances: | 6 |
| JVM Initial Heap (MB): | 1500 |
| JVM Maximum Heap (MB): | 1500 |
| JVM Address Bits: | 64 |
| Boot Firmware Version: | SAV18 |
| Management Firmware Version: | V018 |
| Workload Version: | SSJ 1.2.6 |
| Director Location: | Controller |
| Other Software: | IBM Websphere application server V7.0 for Windows on X86-64bit |
| JVM Instance | ssj_ops@100% |
|---|---|
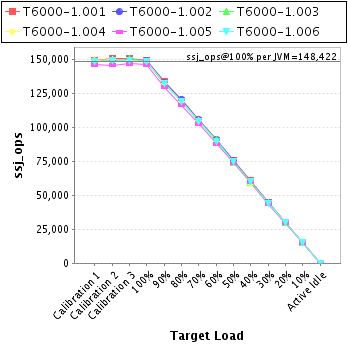
| T6000-1.001 | 149,255 |
| T6000-1.002 | 149,236 |
| T6000-1.003 | 148,781 |
| T6000-1.004 | 148,767 |
| T6000-1.005 | 146,209 |
| T6000-1.006 | 148,284 |
| ssj_ops@100% | 890,533 |
| ssj_ops@100% per JVM | 148,422 |
| Target Load | Actual Load | ssj_ops | |
|---|---|---|---|
| Target | Actual | ||
| Calibration 1 | 149,332 | ||
| Calibration 2 | 150,965 | ||
| Calibration 3 | 150,404 | ||
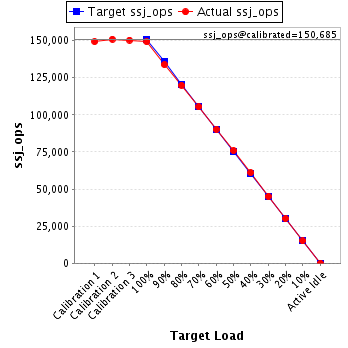
| ssj_ops@calibrated=150,685 | |||
| 100% | 99.1% | 150,685 | 149,255 |
| 90% | 88.8% | 135,616 | 133,822 |
| 80% | 79.6% | 120,548 | 119,932 |
| 70% | 69.9% | 105,479 | 105,312 |
| 60% | 59.9% | 90,411 | 90,270 |
| 50% | 50.4% | 75,342 | 75,875 |
| 40% | 40.5% | 60,274 | 61,074 |
| 30% | 29.9% | 45,205 | 45,047 |
| 20% | 19.9% | 30,137 | 30,048 |
| 10% | 10.0% | 15,068 | 15,062 |
| Active Idle | 0 | 0 | |
| Target Load | Actual Load | ssj_ops | |
|---|---|---|---|
| Target | Actual | ||
| Calibration 1 | 148,447 | ||
| Calibration 2 | 150,208 | ||
| Calibration 3 | 150,262 | ||
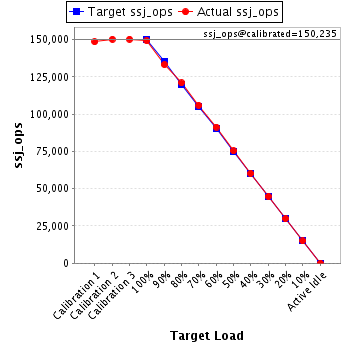
| ssj_ops@calibrated=150,235 | |||
| 100% | 99.3% | 150,235 | 149,236 |
| 90% | 88.6% | 135,212 | 133,180 |
| 80% | 80.5% | 120,188 | 120,897 |
| 70% | 70.5% | 105,165 | 105,951 |
| 60% | 60.8% | 90,141 | 91,346 |
| 50% | 50.1% | 75,118 | 75,308 |
| 40% | 40.1% | 60,094 | 60,237 |
| 30% | 29.9% | 45,071 | 44,882 |
| 20% | 19.9% | 30,047 | 29,856 |
| 10% | 9.9% | 15,024 | 14,937 |
| Active Idle | 0 | 0 | |
| Target Load | Actual Load | ssj_ops | |
|---|---|---|---|
| Target | Actual | ||
| Calibration 1 | 149,251 | ||
| Calibration 2 | 148,843 | ||
| Calibration 3 | 150,498 | ||
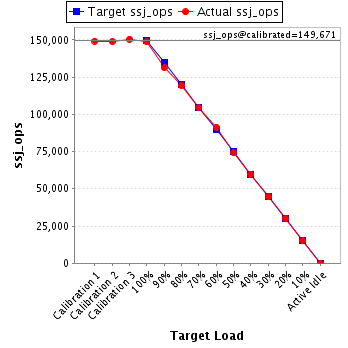
| ssj_ops@calibrated=149,671 | |||
| 100% | 99.4% | 149,671 | 148,781 |
| 90% | 87.7% | 134,704 | 131,253 |
| 80% | 79.8% | 119,737 | 119,376 |
| 70% | 69.8% | 104,770 | 104,426 |
| 60% | 61.0% | 89,802 | 91,324 |
| 50% | 49.7% | 74,835 | 74,319 |
| 40% | 39.9% | 59,868 | 59,664 |
| 30% | 29.8% | 44,901 | 44,648 |
| 20% | 20.0% | 29,934 | 29,907 |
| 10% | 10.0% | 14,967 | 15,023 |
| Active Idle | 0 | 0 | |
| Target Load | Actual Load | ssj_ops | |
|---|---|---|---|
| Target | Actual | ||
| Calibration 1 | 149,120 | ||
| Calibration 2 | 149,764 | ||
| Calibration 3 | 149,418 | ||
| ssj_ops@calibrated=149,591 | |||
| 100% | 99.4% | 149,591 | 148,767 |
| 90% | 88.4% | 134,632 | 132,174 |
| 80% | 79.7% | 119,673 | 119,289 |
| 70% | 70.2% | 104,714 | 104,991 |
| 60% | 60.1% | 89,755 | 89,957 |
| 50% | 49.8% | 74,796 | 74,536 |
| 40% | 39.5% | 59,836 | 59,062 |
| 30% | 29.6% | 44,877 | 44,328 |
| 20% | 20.1% | 29,918 | 30,056 |
| 10% | 10.1% | 14,959 | 15,158 |
| Active Idle | 0 | 0 | |

| Target Load | Actual Load | ssj_ops | |
|---|---|---|---|
| Target | Actual | ||
| Calibration 1 | 145,956 | ||
| Calibration 2 | 145,728 | ||
| Calibration 3 | 146,915 | ||
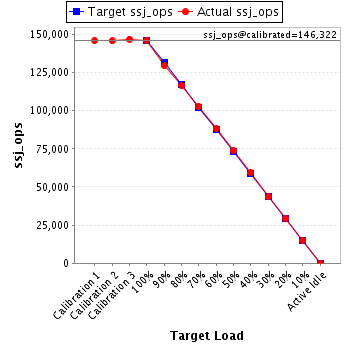
| ssj_ops@calibrated=146,322 | |||
| 100% | 99.9% | 146,322 | 146,209 |
| 90% | 88.5% | 131,689 | 129,544 |
| 80% | 79.6% | 117,057 | 116,415 |
| 70% | 70.3% | 102,425 | 102,880 |
| 60% | 60.2% | 87,793 | 88,098 |
| 50% | 50.5% | 73,161 | 73,849 |
| 40% | 40.7% | 58,529 | 59,544 |
| 30% | 29.7% | 43,896 | 43,501 |
| 20% | 20.0% | 29,264 | 29,319 |
| 10% | 10.2% | 14,632 | 14,992 |
| Active Idle | 0 | 0 | |
| Target Load | Actual Load | ssj_ops | |
|---|---|---|---|
| Target | Actual | ||
| Calibration 1 | 148,487 | ||
| Calibration 2 | 149,046 | ||
| Calibration 3 | 149,295 | ||
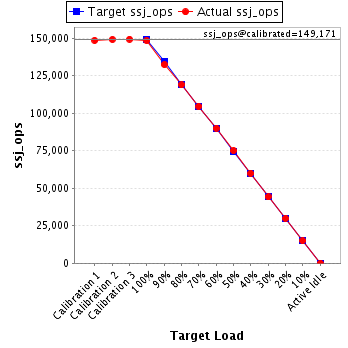
| ssj_ops@calibrated=149,171 | |||
| 100% | 99.4% | 149,171 | 148,284 |
| 90% | 88.7% | 134,254 | 132,362 |
| 80% | 79.6% | 119,337 | 118,790 |
| 70% | 70.1% | 104,420 | 104,546 |
| 60% | 60.3% | 89,502 | 89,992 |
| 50% | 50.3% | 74,585 | 75,074 |
| 40% | 40.2% | 59,668 | 59,949 |
| 30% | 29.6% | 44,751 | 44,184 |
| 20% | 20.1% | 29,834 | 29,991 |
| 10% | 10.0% | 14,917 | 14,979 |
| Active Idle | 0 | 0 | |