SPECpower_ssj2008
Host 'Peralta-3' Performance Report
Copyright © 2007-2011 Standard Performance Evaluation Corporation
| SGI Rackable C2112-4TY14 | ssj_ops@100% = 726,290 ssj_ops@100% per JVM = 121,048 |
||||
| Test Sponsor: | SGI | SPEC License #: | 4 | Test Method: | Multi Node |
| Tested By: | SGI | Test Location: | Fremont, CA, USA | Test Date: | Jan 6, 2011 |
| Hardware Availability: | Feb-2011 | Software Availability: | Dec-2010 | Publication: | Jan 26, 2011 |
| System Source: | Single Supplier | System Designation: | Server | Power Provisioning: | Line-powered |
| Target Load | Actual Load | ssj_ops | |
|---|---|---|---|
| Target | Actual | ||
| Calibration 1 | 727,638 | ||
| Calibration 2 | 732,819 | ||
| Calibration 3 | 731,411 | ||
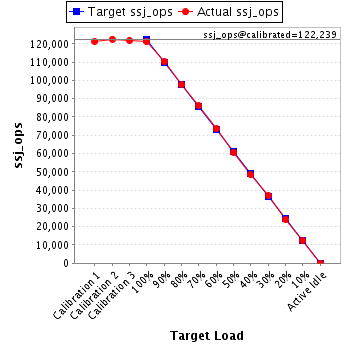
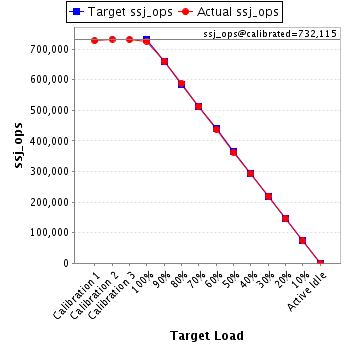
| ssj_ops@calibrated=732,115 | |||
| 100% | 99.2% | 732,115 | 726,290 |
| 90% | 90.2% | 658,904 | 660,729 |
| 80% | 80.3% | 585,692 | 588,216 |
| 70% | 70.0% | 512,481 | 512,827 |
| 60% | 59.8% | 439,269 | 437,845 |
| 50% | 49.7% | 366,058 | 363,585 |
| 40% | 39.9% | 292,846 | 292,156 |
| 30% | 30.0% | 219,635 | 219,641 |
| 20% | 19.8% | 146,423 | 145,278 |
| 10% | 10.1% | 73,212 | 73,608 |
| Active Idle | 0 | 0 | |
| Set Identifier: | sut |
| Set Description: | Rackable C2112-4TY14 |
| # of Identical Nodes: | 4 |
| Comment: | None |
| Hardware | |
|---|---|
| Hardware Vendor: | SGI |
| Model: | Rackable C2112-4TY14 |
| Form Factor: | Blade |
| CPU Name: | Intel Xeon L5640 |
| CPU Characteristics: | Six-Core, 2.27 GHz, 12 MB L3 Cache |
| CPU Frequency (MHz): | 2267 |
| CPU(s) Enabled: | 12 cores, 2 chips, 6 cores/chip |
| Hardware Threads: | 24 (2 / core) |
| CPU(s) Orderable: | 1,2 chips |
| Primary Cache: | 32 KB I + 32 KB D on chip per core |
| Secondary Cache: | 256 KB I+D on chip per core |
| Tertiary Cache: | 12 MB I+D on chip per chip |
| Other Cache: | None |
| Memory Amount (GB): | 16 |
| # and size of DIMM: | 4 x 4096 MB |
| Memory Details: | 4GB 2Rx8 PC3L-10600R; slots 1A and 2A populated for each processor |
| Power Supply Quantity and Rating (W): | None |
| Power Supply Details: | Shared |
| Disk Drive: | 1 x 60 GB SATA SSD, SGI Part #SGICSTE025M31-0060 |
| Disk Controller: | Intel ESB2 based Integrated SATA controller |
| # and type of Network Interface Cards (NICs) Installed: | 2 x Integrated Intel 82574L Gigabit Ethernet |
| NICs Enabled in Firmware / OS / Connected: | 2/2/1 |
| Network Speed (Mbit): | 1000 |
| Keyboard: | None |
| Mouse: | None |
| Monitor: | None |
| Optical Drives: | No |
| Other Hardware: | None |
| Software | |
|---|---|
| Power Management: | power saver enabled in OS |
| Operating System (OS): | Microsoft Windows Server 2008 R2 Enterprise Edition |
| OS Version: | 64bit |
| Filesystem: | NTFS |
| JVM Vendor: | IBM Corporation |
| JVM Version: | IBM J9 VM (build 2.4, JRE 1.6.0 IBM J9 2.4 Windows Server 2008 amd64-64 jvmwa6460sr7-20091214_49398 (JIT enabled, AOT enabled) |
| JVM Command-line Options: | -Xmn1600m -Xms2000m -Xmx2000m -Xaggressive -Xcompressedrefs -Xgcpolicy:gencon -XlockReservation -Xnoloa -XtlhPrefetch -Xlp |
| JVM Affinity: | start /AFFINITY [F F0 F00 F000 F0000 F00000] |
| JVM Instances: | 6 |
| JVM Initial Heap (MB): | 2000 |
| JVM Maximum Heap (MB): | 2000 |
| JVM Address Bits: | 64 |
| Boot Firmware Version: | 2.0c.b01 |
| Management Firmware Version: | None |
| Workload Version: | SSJ 1.2.6 |
| Director Location: | Controller |
| Other Software: | IBM Websphere Application Server Community Edition V2.1.1.4 for windows on X86-64bit |
| JVM Instance | ssj_ops@100% |
|---|---|
| Peralta-3.001 | 122,226 |
| Peralta-3.002 | 118,817 |
| Peralta-3.003 | 122,148 |
| Peralta-3.004 | 121,646 |
| Peralta-3.005 | 120,311 |
| Peralta-3.006 | 121,142 |
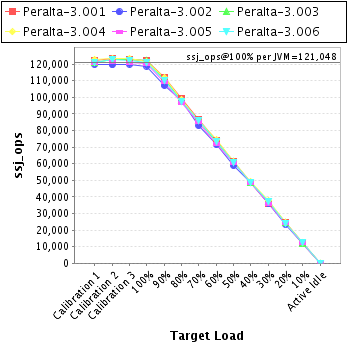
| ssj_ops@100% | 726,290 |
| ssj_ops@100% per JVM | 121,048 |
| Target Load | Actual Load | ssj_ops | |
|---|---|---|---|
| Target | Actual | ||
| Calibration 1 | 121,906 | ||
| Calibration 2 | 123,566 | ||
| Calibration 3 | 122,685 | ||
| ssj_ops@calibrated=123,126 | |||
| 100% | 99.3% | 123,126 | 122,226 |
| 90% | 90.7% | 110,813 | 111,632 |
| 80% | 80.8% | 98,501 | 99,487 |
| 70% | 70.5% | 86,188 | 86,764 |
| 60% | 60.1% | 73,875 | 74,025 |
| 50% | 49.6% | 61,563 | 61,071 |
| 40% | 39.7% | 49,250 | 48,847 |
| 30% | 29.4% | 36,938 | 36,161 |
| 20% | 19.9% | 24,625 | 24,467 |
| 10% | 10.3% | 12,313 | 12,637 |
| Active Idle | 0 | 0 | |

| Target Load | Actual Load | ssj_ops | |
|---|---|---|---|
| Target | Actual | ||
| Calibration 1 | 119,794 | ||
| Calibration 2 | 119,467 | ||
| Calibration 3 | 120,025 | ||
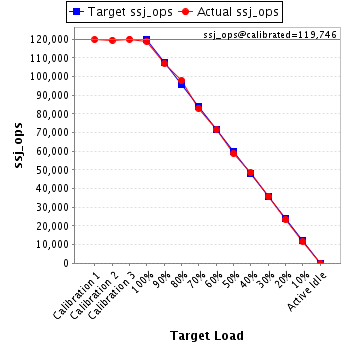
| ssj_ops@calibrated=119,746 | |||
| 100% | 99.2% | 119,746 | 118,817 |
| 90% | 89.5% | 107,771 | 107,152 |
| 80% | 81.7% | 95,797 | 97,789 |
| 70% | 69.3% | 83,822 | 82,960 |
| 60% | 59.7% | 71,847 | 71,500 |
| 50% | 49.1% | 59,873 | 58,819 |
| 40% | 40.5% | 47,898 | 48,516 |
| 30% | 30.0% | 35,924 | 35,929 |
| 20% | 19.6% | 23,949 | 23,503 |
| 10% | 9.9% | 11,975 | 11,823 |
| Active Idle | 0 | 0 | |
| Target Load | Actual Load | ssj_ops | |
|---|---|---|---|
| Target | Actual | ||
| Calibration 1 | 121,233 | ||
| Calibration 2 | 122,996 | ||
| Calibration 3 | 122,747 | ||
| ssj_ops@calibrated=122,872 | |||
| 100% | 99.4% | 122,872 | 122,148 |
| 90% | 90.0% | 110,584 | 110,606 |
| 80% | 80.0% | 98,297 | 98,268 |
| 70% | 70.2% | 86,010 | 86,277 |
| 60% | 59.2% | 73,723 | 72,764 |
| 50% | 49.7% | 61,436 | 61,101 |
| 40% | 39.8% | 49,149 | 48,870 |
| 30% | 30.2% | 36,861 | 37,052 |
| 20% | 19.8% | 24,574 | 24,278 |
| 10% | 9.9% | 12,287 | 12,164 |
| Active Idle | 0 | 0 | |
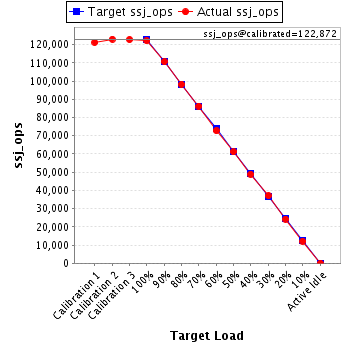
| Target Load | Actual Load | ssj_ops | |
|---|---|---|---|
| Target | Actual | ||
| Calibration 1 | 122,835 | ||
| Calibration 2 | 123,173 | ||
| Calibration 3 | 123,142 | ||
| ssj_ops@calibrated=123,157 | |||
| 100% | 98.8% | 123,157 | 121,646 |
| 90% | 90.8% | 110,842 | 111,777 |
| 80% | 79.9% | 98,526 | 98,424 |
| 70% | 69.6% | 86,210 | 85,726 |
| 60% | 60.3% | 73,894 | 74,306 |
| 50% | 49.9% | 61,579 | 61,409 |
| 40% | 39.8% | 49,263 | 49,004 |
| 30% | 30.5% | 36,947 | 37,586 |
| 20% | 20.2% | 24,631 | 24,847 |
| 10% | 10.1% | 12,316 | 12,416 |
| Active Idle | 0 | 0 | |
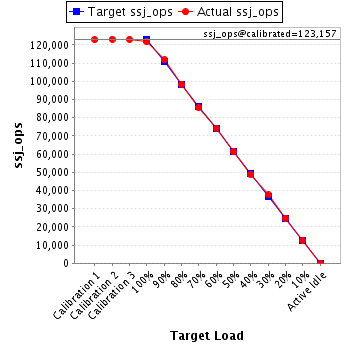
| Target Load | Actual Load | ssj_ops | |
|---|---|---|---|
| Target | Actual | ||
| Calibration 1 | 120,670 | ||
| Calibration 2 | 121,065 | ||
| Calibration 3 | 120,886 | ||
| ssj_ops@calibrated=120,975 | |||
| 100% | 99.5% | 120,975 | 120,311 |
| 90% | 90.2% | 108,878 | 109,146 |
| 80% | 79.9% | 96,780 | 96,604 |
| 70% | 70.2% | 84,683 | 84,956 |
| 60% | 59.2% | 72,585 | 71,659 |
| 50% | 50.0% | 60,488 | 60,465 |
| 40% | 40.1% | 48,390 | 48,468 |
| 30% | 29.8% | 36,293 | 35,999 |
| 20% | 20.0% | 24,195 | 24,176 |
| 10% | 10.1% | 12,098 | 12,178 |
| Active Idle | 0 | 0 | |
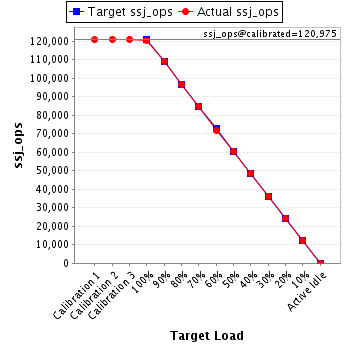
| Target Load | Actual Load | ssj_ops | |
|---|---|---|---|
| Target | Actual | ||
| Calibration 1 | 121,200 | ||
| Calibration 2 | 122,553 | ||
| Calibration 3 | 121,925 | ||
| ssj_ops@calibrated=122,239 | |||
| 100% | 99.1% | 122,239 | 121,142 |
| 90% | 90.3% | 110,015 | 110,416 |
| 80% | 79.9% | 97,792 | 97,646 |
| 70% | 70.5% | 85,568 | 86,143 |
| 60% | 60.2% | 73,344 | 73,591 |
| 50% | 49.7% | 61,120 | 60,720 |
| 40% | 39.6% | 48,896 | 48,451 |
| 30% | 30.2% | 36,672 | 36,914 |
| 20% | 19.6% | 24,448 | 24,008 |
| 10% | 10.1% | 12,224 | 12,391 |
| Active Idle | 0 | 0 | |
