SPECpower_ssj2008
Host 'M610-5' Performance Report
Copyright © 2007-2010 Standard Performance Evaluation Corporation
| Dell Inc. PowerEdge M610 | ssj_ops@100% = 906,159 ssj_ops@100% per JVM = 151,026 |
||||
| Test Sponsor: | Dell Inc. | SPEC License #: | 55 | Test Method: | Multi Node |
| Tested By: | Dell Inc. | Test Location: | Round Rock, TX, USA | Test Date: | Aug 12, 2010 |
| Hardware Availability: | Sep-2010 | Software Availability: | Jul-2009 | Publication: | Sep 9, 2010 |
| System Source: | Single Supplier | System Designation: | Server | Power Provisioning: | Line-powered |
| Target Load | Actual Load | ssj_ops | |
|---|---|---|---|
| Target | Actual | ||
| Calibration 1 | 909,266 | ||
| Calibration 2 | 913,614 | ||
| Calibration 3 | 911,472 | ||
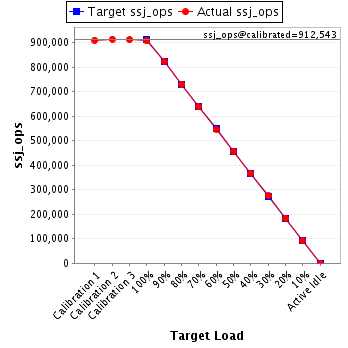
| ssj_ops@calibrated=912,543 | |||
| 100% | 99.3% | 912,543 | 906,159 |
| 90% | 90.2% | 821,288 | 823,173 |
| 80% | 80.0% | 730,034 | 729,775 |
| 70% | 70.0% | 638,780 | 638,769 |
| 60% | 59.9% | 547,526 | 546,711 |
| 50% | 50.0% | 456,271 | 456,385 |
| 40% | 40.2% | 365,017 | 367,276 |
| 30% | 30.2% | 273,763 | 275,335 |
| 20% | 20.1% | 182,509 | 183,824 |
| 10% | 10.0% | 91,254 | 91,014 |
| Active Idle | 0 | 0 | |
| Set Identifier: | sut |
| Set Description: | PowerEdge M610 |
| # of Identical Nodes: | 16 |
| Comment: | None |
| Hardware | |
|---|---|
| Hardware Vendor: | Dell Inc. |
| Model: | PowerEdge M610 |
| Form Factor: | Blade |
| CPU Name: | Intel Xeon X5670 |
| CPU Characteristics: | Six Core, 2.93 GHz, 12 MB L3 Cache |
| CPU Frequency (MHz): | 2933 |
| CPU(s) Enabled: | 12 cores, 2 chips, 6 cores/chip |
| Hardware Threads: | 24 (2 / core) |
| CPU(s) Orderable: | 1,2 chip |
| Primary Cache: | 32 KB I + 32 KB D on chip per core |
| Secondary Cache: | 256 KB I+D on chip per core |
| Tertiary Cache: | 12 MB I+D on chip per chip |
| Other Cache: | None |
| Memory Amount (GB): | 12 |
| # and size of DIMM: | 6 x 2048 MB |
| Memory Details: | 2GB 2Rx8 PC3L-10600E ECC, Slots A1-A3, B1-B3 populated |
| Power Supply Quantity and Rating (W): | None |
| Power Supply Details: | Shared |
| Disk Drive: | 1 x 50GB 2.5" SSD SATA (Dell PN Y949P) |
| Disk Controller: | Modular SATA Pass-Through |
| # and type of Network Interface Cards (NICs) Installed: | 1 x onboard dual-port Gigabit Ethernet |
| NICs Enabled in Firmware / OS / Connected: | 2/1/1 |
| Network Speed (Mbit): | 1000 |
| Keyboard: | None |
| Mouse: | None |
| Monitor: | None |
| Optical Drives: | No |
| Other Hardware: | None |
| Software | |
|---|---|
| Power Management: | Power Saver Mode in OS (See Notes) |
| Operating System (OS): | Windows 2008 Server Enterprise x64 Edition |
| OS Version: | R2 |
| Filesystem: | NTFS |
| JVM Vendor: | IBM Corporation |
| JVM Version: | IBM J9 VM (build 2.4, J2RE 1.6.0 IBM J9 2.4 Windows Server 2008 amd64-64 jvmwa64 60sr5-20090519_35743 (JIT enabled, AOT enabled) |
| JVM Command-line Options: | -Xmn1100m -Xms1500m -Xmx1500m -Xaggressive -Xcompressedrefs -Xgcpolicy:gencon -XlockReservation -Xnoloa -XtlhPrefetch -Xlp |
| JVM Affinity: | start /affinity [F,F0,F00,F000,F0000,F00000] |
| JVM Instances: | 6 |
| JVM Initial Heap (MB): | 1500 |
| JVM Maximum Heap (MB): | 1500 |
| JVM Address Bits: | 64 |
| Boot Firmware Version: | 2.1.9 |
| Management Firmware Version: | iDRAC 3.0.0 A02 / CMC 3.0.1 A00 |
| Workload Version: | SSJ 1.2.6 |
| Director Location: | Controller |
| Other Software: | None |
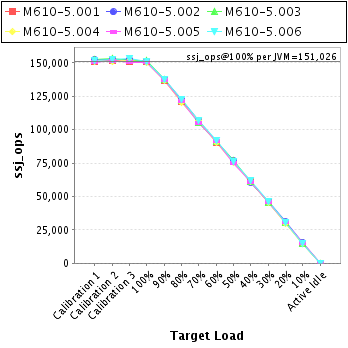
| JVM Instance | ssj_ops@100% |
|---|---|
| M610-5.001 | 150,943 |
| M610-5.002 | 151,393 |
| M610-5.003 | 151,722 |
| M610-5.004 | 150,147 |
| M610-5.005 | 150,747 |
| M610-5.006 | 151,208 |
| ssj_ops@100% | 906,159 |
| ssj_ops@100% per JVM | 151,026 |
| Target Load | Actual Load | ssj_ops | |
|---|---|---|---|
| Target | Actual | ||
| Calibration 1 | 151,112 | ||
| Calibration 2 | 151,879 | ||
| Calibration 3 | 151,290 | ||
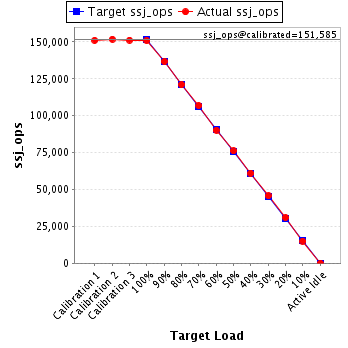
| ssj_ops@calibrated=151,585 | |||
| 100% | 99.6% | 151,585 | 150,943 |
| 90% | 90.2% | 136,426 | 136,755 |
| 80% | 79.8% | 121,268 | 120,973 |
| 70% | 70.5% | 106,109 | 106,920 |
| 60% | 59.6% | 90,951 | 90,272 |
| 50% | 50.2% | 75,792 | 76,116 |
| 40% | 40.3% | 60,634 | 61,126 |
| 30% | 30.1% | 45,475 | 45,671 |
| 20% | 20.4% | 30,317 | 30,897 |
| 10% | 9.9% | 15,158 | 15,046 |
| Active Idle | 0 | 0 | |
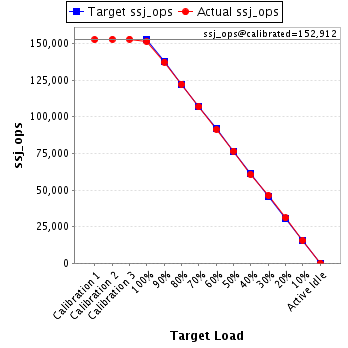
| Target Load | Actual Load | ssj_ops | |
|---|---|---|---|
| Target | Actual | ||
| Calibration 1 | 152,702 | ||
| Calibration 2 | 152,840 | ||
| Calibration 3 | 152,984 | ||
| ssj_ops@calibrated=152,912 | |||
| 100% | 99.0% | 152,912 | 151,393 |
| 90% | 89.8% | 137,621 | 137,352 |
| 80% | 80.0% | 122,329 | 122,287 |
| 70% | 69.9% | 107,038 | 106,811 |
| 60% | 59.8% | 91,747 | 91,393 |
| 50% | 50.1% | 76,456 | 76,612 |
| 40% | 39.6% | 61,165 | 60,523 |
| 30% | 30.2% | 45,874 | 46,222 |
| 20% | 20.2% | 30,582 | 30,940 |
| 10% | 10.2% | 15,291 | 15,612 |
| Active Idle | 0 | 0 | |
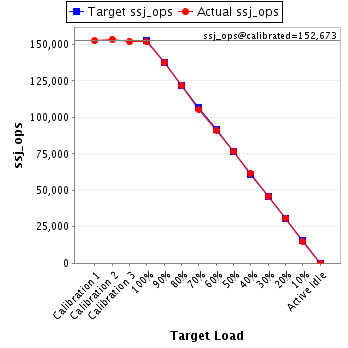
| Target Load | Actual Load | ssj_ops | |
|---|---|---|---|
| Target | Actual | ||
| Calibration 1 | 152,567 | ||
| Calibration 2 | 153,607 | ||
| Calibration 3 | 151,738 | ||
| ssj_ops@calibrated=152,673 | |||
| 100% | 99.4% | 152,673 | 151,722 |
| 90% | 89.9% | 137,405 | 137,324 |
| 80% | 79.9% | 122,138 | 121,950 |
| 70% | 69.2% | 106,871 | 105,632 |
| 60% | 59.8% | 91,604 | 91,239 |
| 50% | 50.3% | 76,336 | 76,862 |
| 40% | 40.3% | 61,069 | 61,473 |
| 30% | 30.0% | 45,802 | 45,782 |
| 20% | 20.2% | 30,535 | 30,866 |
| 10% | 9.8% | 15,267 | 14,992 |
| Active Idle | 0 | 0 | |
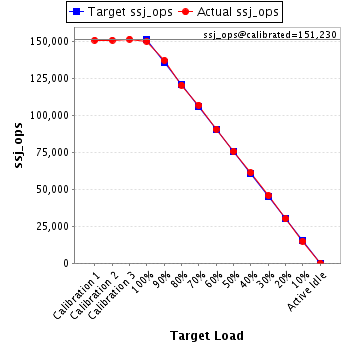
| Target Load | Actual Load | ssj_ops | |
|---|---|---|---|
| Target | Actual | ||
| Calibration 1 | 150,903 | ||
| Calibration 2 | 150,893 | ||
| Calibration 3 | 151,567 | ||
| ssj_ops@calibrated=151,230 | |||
| 100% | 99.3% | 151,230 | 150,147 |
| 90% | 90.8% | 136,107 | 137,244 |
| 80% | 79.7% | 120,984 | 120,457 |
| 70% | 70.7% | 105,861 | 106,980 |
| 60% | 60.0% | 90,738 | 90,744 |
| 50% | 50.1% | 75,615 | 75,719 |
| 40% | 40.5% | 60,492 | 61,215 |
| 30% | 30.3% | 45,369 | 45,798 |
| 20% | 19.9% | 30,246 | 30,071 |
| 10% | 9.9% | 15,123 | 14,965 |
| Active Idle | 0 | 0 | |
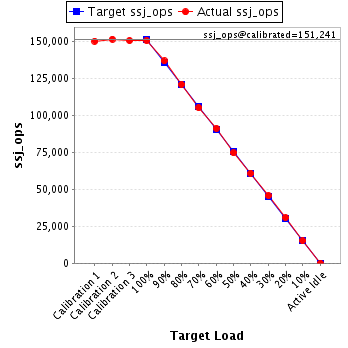
| Target Load | Actual Load | ssj_ops | |
|---|---|---|---|
| Target | Actual | ||
| Calibration 1 | 150,405 | ||
| Calibration 2 | 151,741 | ||
| Calibration 3 | 150,741 | ||
| ssj_ops@calibrated=151,241 | |||
| 100% | 99.7% | 151,241 | 150,747 |
| 90% | 90.6% | 136,117 | 136,980 |
| 80% | 80.1% | 120,993 | 121,163 |
| 70% | 69.6% | 105,869 | 105,296 |
| 60% | 60.4% | 90,745 | 91,346 |
| 50% | 49.4% | 75,621 | 74,787 |
| 40% | 40.3% | 60,496 | 60,953 |
| 30% | 30.3% | 45,372 | 45,769 |
| 20% | 20.4% | 30,248 | 30,845 |
| 10% | 10.1% | 15,124 | 15,233 |
| Active Idle | 0 | 0 | |
| Target Load | Actual Load | ssj_ops | |
|---|---|---|---|
| Target | Actual | ||
| Calibration 1 | 151,578 | ||
| Calibration 2 | 152,654 | ||
| Calibration 3 | 153,151 | ||
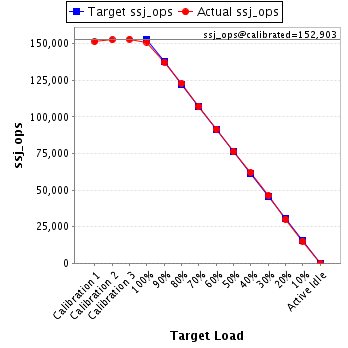
| ssj_ops@calibrated=152,903 | |||
| 100% | 98.9% | 152,903 | 151,208 |
| 90% | 89.9% | 137,612 | 137,518 |
| 80% | 80.4% | 122,322 | 122,944 |
| 70% | 70.1% | 107,032 | 107,130 |
| 60% | 60.0% | 91,742 | 91,718 |
| 50% | 49.9% | 76,451 | 76,289 |
| 40% | 40.5% | 61,161 | 61,986 |
| 30% | 30.1% | 45,871 | 46,094 |
| 20% | 19.8% | 30,581 | 30,204 |
| 10% | 9.9% | 15,290 | 15,166 |
| Active Idle | 0 | 0 | |