SPECpower_ssj2008
Host 'M610-2' Performance Report
Copyright © 2007-2010 Standard Performance Evaluation Corporation
| Dell Inc. PowerEdge M610 | ssj_ops@100% = 909,991 ssj_ops@100% per JVM = 151,665 |
||||
| Test Sponsor: | Dell Inc. | SPEC License #: | 55 | Test Method: | Multi Node |
| Tested By: | Dell Inc. | Test Location: | Round Rock, TX, USA | Test Date: | Aug 12, 2010 |
| Hardware Availability: | Sep-2010 | Software Availability: | Jul-2009 | Publication: | Sep 9, 2010 |
| System Source: | Single Supplier | System Designation: | Server | Power Provisioning: | Line-powered |
| Target Load | Actual Load | ssj_ops | |
|---|---|---|---|
| Target | Actual | ||
| Calibration 1 | 912,522 | ||
| Calibration 2 | 914,979 | ||
| Calibration 3 | 914,837 | ||
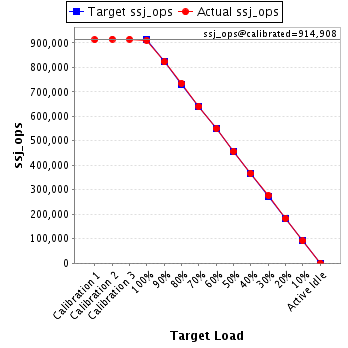
| ssj_ops@calibrated=914,908 | |||
| 100% | 99.5% | 914,908 | 909,991 |
| 90% | 89.9% | 823,417 | 822,445 |
| 80% | 80.3% | 731,926 | 735,015 |
| 70% | 70.0% | 640,435 | 640,085 |
| 60% | 60.1% | 548,945 | 550,172 |
| 50% | 49.9% | 457,454 | 456,610 |
| 40% | 40.1% | 365,963 | 366,507 |
| 30% | 30.2% | 274,472 | 276,549 |
| 20% | 20.0% | 182,982 | 183,039 |
| 10% | 10.0% | 91,491 | 91,229 |
| Active Idle | 0 | 0 | |
| Set Identifier: | sut |
| Set Description: | PowerEdge M610 |
| # of Identical Nodes: | 16 |
| Comment: | None |
| Hardware | |
|---|---|
| Hardware Vendor: | Dell Inc. |
| Model: | PowerEdge M610 |
| Form Factor: | Blade |
| CPU Name: | Intel Xeon X5670 |
| CPU Characteristics: | Six Core, 2.93 GHz, 12 MB L3 Cache |
| CPU Frequency (MHz): | 2933 |
| CPU(s) Enabled: | 12 cores, 2 chips, 6 cores/chip |
| Hardware Threads: | 24 (2 / core) |
| CPU(s) Orderable: | 1,2 chip |
| Primary Cache: | 32 KB I + 32 KB D on chip per core |
| Secondary Cache: | 256 KB I+D on chip per core |
| Tertiary Cache: | 12 MB I+D on chip per chip |
| Other Cache: | None |
| Memory Amount (GB): | 12 |
| # and size of DIMM: | 6 x 2048 MB |
| Memory Details: | 2GB 2Rx8 PC3L-10600E ECC, Slots A1-A3, B1-B3 populated |
| Power Supply Quantity and Rating (W): | None |
| Power Supply Details: | Shared |
| Disk Drive: | 1 x 50GB 2.5" SSD SATA (Dell PN Y949P) |
| Disk Controller: | Modular SATA Pass-Through |
| # and type of Network Interface Cards (NICs) Installed: | 1 x onboard dual-port Gigabit Ethernet |
| NICs Enabled in Firmware / OS / Connected: | 2/1/1 |
| Network Speed (Mbit): | 1000 |
| Keyboard: | None |
| Mouse: | None |
| Monitor: | None |
| Optical Drives: | No |
| Other Hardware: | None |
| Software | |
|---|---|
| Power Management: | Power Saver Mode in OS (See Notes) |
| Operating System (OS): | Windows 2008 Server Enterprise x64 Edition |
| OS Version: | R2 |
| Filesystem: | NTFS |
| JVM Vendor: | IBM Corporation |
| JVM Version: | IBM J9 VM (build 2.4, J2RE 1.6.0 IBM J9 2.4 Windows Server 2008 amd64-64 jvmwa64 60sr5-20090519_35743 (JIT enabled, AOT enabled) |
| JVM Command-line Options: | -Xmn1100m -Xms1500m -Xmx1500m -Xaggressive -Xcompressedrefs -Xgcpolicy:gencon -XlockReservation -Xnoloa -XtlhPrefetch -Xlp |
| JVM Affinity: | start /affinity [F,F0,F00,F000,F0000,F00000] |
| JVM Instances: | 6 |
| JVM Initial Heap (MB): | 1500 |
| JVM Maximum Heap (MB): | 1500 |
| JVM Address Bits: | 64 |
| Boot Firmware Version: | 2.1.9 |
| Management Firmware Version: | iDRAC 3.0.0 A02 / CMC 3.0.1 A00 |
| Workload Version: | SSJ 1.2.6 |
| Director Location: | Controller |
| Other Software: | None |
| JVM Instance | ssj_ops@100% |
|---|---|
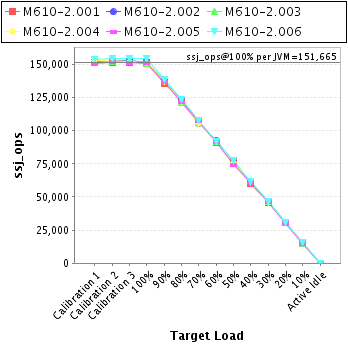
| M610-2.001 | 151,170 |
| M610-2.002 | 151,461 |
| M610-2.003 | 150,502 |
| M610-2.004 | 151,567 |
| M610-2.005 | 150,995 |
| M610-2.006 | 154,296 |
| ssj_ops@100% | 909,991 |
| ssj_ops@100% per JVM | 151,665 |
| Target Load | Actual Load | ssj_ops | |
|---|---|---|---|
| Target | Actual | ||
| Calibration 1 | 151,647 | ||
| Calibration 2 | 151,608 | ||
| Calibration 3 | 151,698 | ||
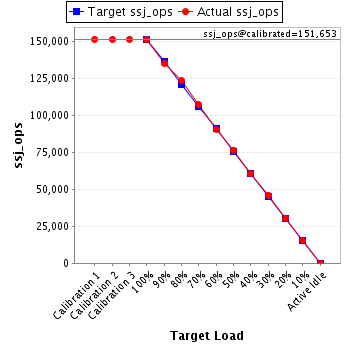
| ssj_ops@calibrated=151,653 | |||
| 100% | 99.7% | 151,653 | 151,170 |
| 90% | 89.2% | 136,488 | 135,275 |
| 80% | 81.5% | 121,322 | 123,614 |
| 70% | 70.8% | 106,157 | 107,330 |
| 60% | 59.8% | 90,992 | 90,743 |
| 50% | 50.6% | 75,826 | 76,670 |
| 40% | 39.9% | 60,661 | 60,528 |
| 30% | 30.4% | 45,496 | 46,137 |
| 20% | 20.1% | 30,331 | 30,426 |
| 10% | 10.1% | 15,165 | 15,258 |
| Active Idle | 0 | 0 | |
| Target Load | Actual Load | ssj_ops | |
|---|---|---|---|
| Target | Actual | ||
| Calibration 1 | 152,298 | ||
| Calibration 2 | 152,614 | ||
| Calibration 3 | 153,091 | ||
| ssj_ops@calibrated=152,853 | |||
| 100% | 99.1% | 152,853 | 151,461 |
| 90% | 90.1% | 137,567 | 137,645 |
| 80% | 80.5% | 122,282 | 123,111 |
| 70% | 69.2% | 106,997 | 105,777 |
| 60% | 60.6% | 91,712 | 92,610 |
| 50% | 49.9% | 76,426 | 76,219 |
| 40% | 39.8% | 61,141 | 60,870 |
| 30% | 29.8% | 45,856 | 45,580 |
| 20% | 20.0% | 30,571 | 30,627 |
| 10% | 10.1% | 15,285 | 15,374 |
| Active Idle | 0 | 0 | |

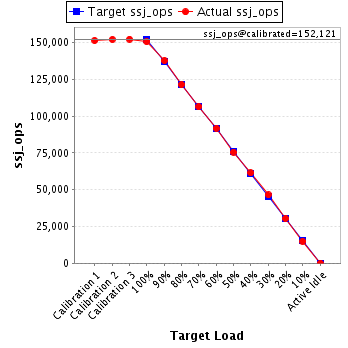
| Target Load | Actual Load | ssj_ops | |
|---|---|---|---|
| Target | Actual | ||
| Calibration 1 | 151,283 | ||
| Calibration 2 | 152,017 | ||
| Calibration 3 | 152,226 | ||
| ssj_ops@calibrated=152,121 | |||
| 100% | 98.9% | 152,121 | 150,502 |
| 90% | 90.5% | 136,909 | 137,662 |
| 80% | 79.7% | 121,697 | 121,265 |
| 70% | 69.9% | 106,485 | 106,287 |
| 60% | 60.3% | 91,273 | 91,741 |
| 50% | 49.7% | 76,061 | 75,568 |
| 40% | 40.3% | 60,849 | 61,349 |
| 30% | 30.6% | 45,636 | 46,488 |
| 20% | 20.0% | 30,424 | 30,427 |
| 10% | 9.8% | 15,212 | 14,956 |
| Active Idle | 0 | 0 | |
| Target Load | Actual Load | ssj_ops | |
|---|---|---|---|
| Target | Actual | ||
| Calibration 1 | 152,894 | ||
| Calibration 2 | 152,606 | ||
| Calibration 3 | 152,434 | ||
| ssj_ops@calibrated=152,520 | |||
| 100% | 99.4% | 152,520 | 151,567 |
| 90% | 89.7% | 137,268 | 136,811 |
| 80% | 80.0% | 122,016 | 122,064 |
| 70% | 69.3% | 106,764 | 105,733 |
| 60% | 60.4% | 91,512 | 92,157 |
| 50% | 49.9% | 76,260 | 76,183 |
| 40% | 40.1% | 61,008 | 61,233 |
| 30% | 30.1% | 45,756 | 45,962 |
| 20% | 20.2% | 30,504 | 30,838 |
| 10% | 10.1% | 15,252 | 15,333 |
| Active Idle | 0 | 0 | |

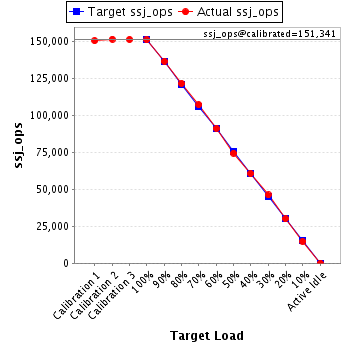
| Target Load | Actual Load | ssj_ops | |
|---|---|---|---|
| Target | Actual | ||
| Calibration 1 | 150,355 | ||
| Calibration 2 | 151,458 | ||
| Calibration 3 | 151,225 | ||
| ssj_ops@calibrated=151,341 | |||
| 100% | 99.8% | 151,341 | 150,995 |
| 90% | 90.2% | 136,207 | 136,515 |
| 80% | 80.3% | 121,073 | 121,541 |
| 70% | 70.8% | 105,939 | 107,107 |
| 60% | 60.2% | 90,805 | 91,134 |
| 50% | 49.2% | 75,671 | 74,424 |
| 40% | 40.0% | 60,536 | 60,602 |
| 30% | 30.5% | 45,402 | 46,144 |
| 20% | 19.8% | 30,268 | 29,965 |
| 10% | 9.8% | 15,134 | 14,767 |
| Active Idle | 0 | 0 | |
| Target Load | Actual Load | ssj_ops | |
|---|---|---|---|
| Target | Actual | ||
| Calibration 1 | 154,046 | ||
| Calibration 2 | 154,675 | ||
| Calibration 3 | 154,164 | ||
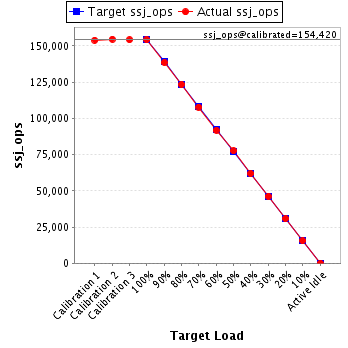
| ssj_ops@calibrated=154,420 | |||
| 100% | 99.9% | 154,420 | 154,296 |
| 90% | 89.7% | 138,978 | 138,538 |
| 80% | 79.9% | 123,536 | 123,420 |
| 70% | 69.8% | 108,094 | 107,850 |
| 60% | 59.4% | 92,652 | 91,787 |
| 50% | 50.2% | 77,210 | 77,545 |
| 40% | 40.1% | 61,768 | 61,925 |
| 30% | 29.9% | 46,326 | 46,238 |
| 20% | 19.9% | 30,884 | 30,756 |
| 10% | 10.1% | 15,442 | 15,542 |
| Active Idle | 0 | 0 | |