SPECpower_ssj2008
Host 'M610-16' Performance Report
Copyright © 2007-2010 Standard Performance Evaluation Corporation
| Dell Inc. PowerEdge M610 | ssj_ops@100% = 908,730 ssj_ops@100% per JVM = 151,455 |
||||
| Test Sponsor: | Dell Inc. | SPEC License #: | 55 | Test Method: | Multi Node |
| Tested By: | Dell Inc. | Test Location: | Round Rock, TX, USA | Test Date: | Aug 12, 2010 |
| Hardware Availability: | Sep-2010 | Software Availability: | Jul-2009 | Publication: | Sep 9, 2010 |
| System Source: | Single Supplier | System Designation: | Server | Power Provisioning: | Line-powered |
| Target Load | Actual Load | ssj_ops | |
|---|---|---|---|
| Target | Actual | ||
| Calibration 1 | 907,612 | ||
| Calibration 2 | 913,814 | ||
| Calibration 3 | 911,968 | ||
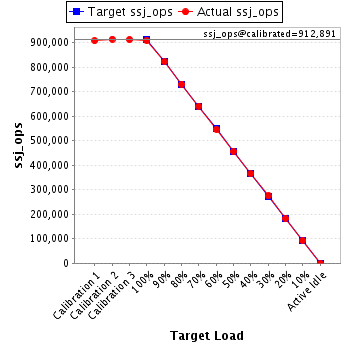
| ssj_ops@calibrated=912,891 | |||
| 100% | 99.5% | 912,891 | 908,730 |
| 90% | 90.1% | 821,602 | 822,139 |
| 80% | 80.0% | 730,313 | 730,226 |
| 70% | 70.2% | 639,024 | 640,560 |
| 60% | 59.8% | 547,735 | 546,242 |
| 50% | 50.0% | 456,445 | 456,341 |
| 40% | 40.0% | 365,156 | 365,023 |
| 30% | 30.1% | 273,867 | 274,384 |
| 20% | 20.0% | 182,578 | 182,575 |
| 10% | 10.1% | 91,289 | 91,771 |
| Active Idle | 0 | 0 | |
| Set Identifier: | sut |
| Set Description: | PowerEdge M610 |
| # of Identical Nodes: | 16 |
| Comment: | None |
| Hardware | |
|---|---|
| Hardware Vendor: | Dell Inc. |
| Model: | PowerEdge M610 |
| Form Factor: | Blade |
| CPU Name: | Intel Xeon X5670 |
| CPU Characteristics: | Six Core, 2.93 GHz, 12 MB L3 Cache |
| CPU Frequency (MHz): | 2933 |
| CPU(s) Enabled: | 12 cores, 2 chips, 6 cores/chip |
| Hardware Threads: | 24 (2 / core) |
| CPU(s) Orderable: | 1,2 chip |
| Primary Cache: | 32 KB I + 32 KB D on chip per core |
| Secondary Cache: | 256 KB I+D on chip per core |
| Tertiary Cache: | 12 MB I+D on chip per chip |
| Other Cache: | None |
| Memory Amount (GB): | 12 |
| # and size of DIMM: | 6 x 2048 MB |
| Memory Details: | 2GB 2Rx8 PC3L-10600E ECC, Slots A1-A3, B1-B3 populated |
| Power Supply Quantity and Rating (W): | None |
| Power Supply Details: | Shared |
| Disk Drive: | 1 x 50GB 2.5" SSD SATA (Dell PN Y949P) |
| Disk Controller: | Modular SATA Pass-Through |
| # and type of Network Interface Cards (NICs) Installed: | 1 x onboard dual-port Gigabit Ethernet |
| NICs Enabled in Firmware / OS / Connected: | 2/1/1 |
| Network Speed (Mbit): | 1000 |
| Keyboard: | None |
| Mouse: | None |
| Monitor: | None |
| Optical Drives: | No |
| Other Hardware: | None |
| Software | |
|---|---|
| Power Management: | Power Saver Mode in OS (See Notes) |
| Operating System (OS): | Windows 2008 Server Enterprise x64 Edition |
| OS Version: | R2 |
| Filesystem: | NTFS |
| JVM Vendor: | IBM Corporation |
| JVM Version: | IBM J9 VM (build 2.4, J2RE 1.6.0 IBM J9 2.4 Windows Server 2008 amd64-64 jvmwa64 60sr5-20090519_35743 (JIT enabled, AOT enabled) |
| JVM Command-line Options: | -Xmn1100m -Xms1500m -Xmx1500m -Xaggressive -Xcompressedrefs -Xgcpolicy:gencon -XlockReservation -Xnoloa -XtlhPrefetch -Xlp |
| JVM Affinity: | start /affinity [F,F0,F00,F000,F0000,F00000] |
| JVM Instances: | 6 |
| JVM Initial Heap (MB): | 1500 |
| JVM Maximum Heap (MB): | 1500 |
| JVM Address Bits: | 64 |
| Boot Firmware Version: | 2.1.9 |
| Management Firmware Version: | iDRAC 3.0.0 A02 / CMC 3.0.1 A00 |
| Workload Version: | SSJ 1.2.6 |
| Director Location: | Controller |
| Other Software: | None |
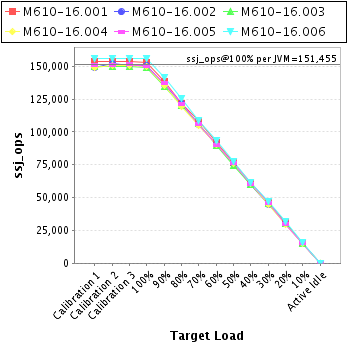
| JVM Instance | ssj_ops@100% |
|---|---|
| M610-16.001 | 153,025 |
| M610-16.002 | 150,928 |
| M610-16.003 | 149,001 |
| M610-16.004 | 150,181 |
| M610-16.005 | 150,061 |
| M610-16.006 | 155,533 |
| ssj_ops@100% | 908,730 |
| ssj_ops@100% per JVM | 151,455 |
| Target Load | Actual Load | ssj_ops | |
|---|---|---|---|
| Target | Actual | ||
| Calibration 1 | 153,499 | ||
| Calibration 2 | 153,836 | ||
| Calibration 3 | 153,307 | ||
| ssj_ops@calibrated=153,571 | |||
| 100% | 99.6% | 153,571 | 153,025 |
| 90% | 90.1% | 138,214 | 138,354 |
| 80% | 79.4% | 122,857 | 121,896 |
| 70% | 70.8% | 107,500 | 108,786 |
| 60% | 60.1% | 92,143 | 92,296 |
| 50% | 49.9% | 76,786 | 76,632 |
| 40% | 40.1% | 61,428 | 61,583 |
| 30% | 30.0% | 46,071 | 45,997 |
| 20% | 20.0% | 30,714 | 30,669 |
| 10% | 9.8% | 15,357 | 15,096 |
| Active Idle | 0 | 0 | |

| Target Load | Actual Load | ssj_ops | |
|---|---|---|---|
| Target | Actual | ||
| Calibration 1 | 148,879 | ||
| Calibration 2 | 151,915 | ||
| Calibration 3 | 150,781 | ||
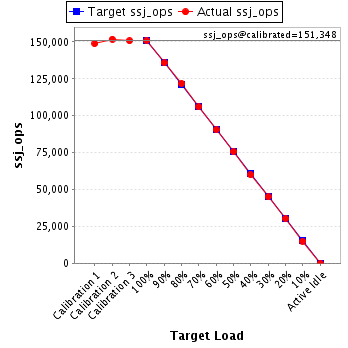
| ssj_ops@calibrated=151,348 | |||
| 100% | 99.7% | 151,348 | 150,928 |
| 90% | 89.7% | 136,213 | 135,823 |
| 80% | 80.4% | 121,078 | 121,745 |
| 70% | 70.0% | 105,943 | 106,005 |
| 60% | 59.8% | 90,809 | 90,524 |
| 50% | 50.0% | 75,674 | 75,678 |
| 40% | 39.6% | 60,539 | 59,943 |
| 30% | 29.7% | 45,404 | 44,999 |
| 20% | 19.9% | 30,270 | 30,135 |
| 10% | 9.9% | 15,135 | 15,041 |
| Active Idle | 0 | 0 | |
| Target Load | Actual Load | ssj_ops | |
|---|---|---|---|
| Target | Actual | ||
| Calibration 1 | 149,653 | ||
| Calibration 2 | 150,041 | ||
| Calibration 3 | 149,842 | ||
| ssj_ops@calibrated=149,941 | |||
| 100% | 99.4% | 149,941 | 149,001 |
| 90% | 89.6% | 134,947 | 134,354 |
| 80% | 80.2% | 119,953 | 120,254 |
| 70% | 70.8% | 104,959 | 106,105 |
| 60% | 59.8% | 89,965 | 89,666 |
| 50% | 49.7% | 74,971 | 74,468 |
| 40% | 40.0% | 59,977 | 60,007 |
| 30% | 30.3% | 44,982 | 45,487 |
| 20% | 20.3% | 29,988 | 30,378 |
| 10% | 10.2% | 14,994 | 15,278 |
| Active Idle | 0 | 0 | |

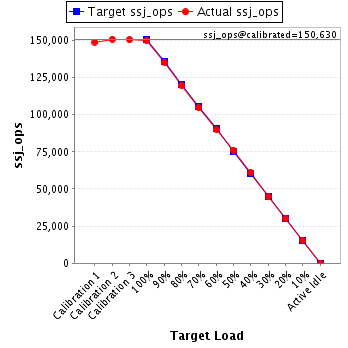
| Target Load | Actual Load | ssj_ops | |
|---|---|---|---|
| Target | Actual | ||
| Calibration 1 | 148,884 | ||
| Calibration 2 | 150,811 | ||
| Calibration 3 | 150,449 | ||
| ssj_ops@calibrated=150,630 | |||
| 100% | 99.7% | 150,630 | 150,181 |
| 90% | 89.8% | 135,567 | 135,311 |
| 80% | 79.5% | 120,504 | 119,695 |
| 70% | 69.6% | 105,441 | 104,780 |
| 60% | 59.8% | 90,378 | 90,138 |
| 50% | 50.4% | 75,315 | 75,975 |
| 40% | 40.5% | 60,252 | 60,970 |
| 30% | 29.7% | 45,189 | 44,734 |
| 20% | 19.8% | 30,126 | 29,841 |
| 10% | 10.2% | 15,063 | 15,367 |
| Active Idle | 0 | 0 | |
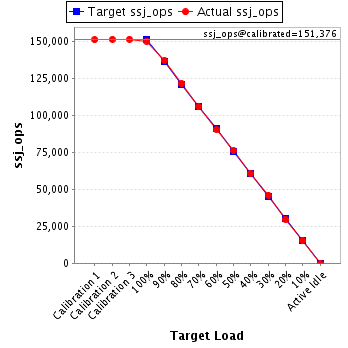
| Target Load | Actual Load | ssj_ops | |
|---|---|---|---|
| Target | Actual | ||
| Calibration 1 | 151,100 | ||
| Calibration 2 | 151,297 | ||
| Calibration 3 | 151,454 | ||
| ssj_ops@calibrated=151,376 | |||
| 100% | 99.1% | 151,376 | 150,061 |
| 90% | 90.5% | 136,238 | 137,031 |
| 80% | 80.3% | 121,101 | 121,527 |
| 70% | 70.0% | 105,963 | 105,955 |
| 60% | 59.7% | 90,825 | 90,410 |
| 50% | 50.3% | 75,688 | 76,108 |
| 40% | 40.1% | 60,550 | 60,711 |
| 30% | 30.4% | 45,413 | 46,037 |
| 20% | 19.7% | 30,275 | 29,854 |
| 10% | 10.1% | 15,138 | 15,353 |
| Active Idle | 0 | 0 | |
| Target Load | Actual Load | ssj_ops | |
|---|---|---|---|
| Target | Actual | ||
| Calibration 1 | 155,597 | ||
| Calibration 2 | 155,915 | ||
| Calibration 3 | 156,136 | ||
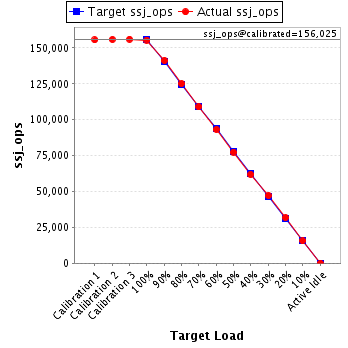
| ssj_ops@calibrated=156,025 | |||
| 100% | 99.7% | 156,025 | 155,533 |
| 90% | 90.5% | 140,423 | 141,266 |
| 80% | 80.2% | 124,820 | 125,108 |
| 70% | 69.8% | 109,218 | 108,930 |
| 60% | 59.7% | 93,615 | 93,207 |
| 50% | 49.7% | 78,013 | 77,480 |
| 40% | 39.6% | 62,410 | 61,808 |
| 30% | 30.2% | 46,808 | 47,130 |
| 20% | 20.3% | 31,205 | 31,698 |
| 10% | 10.0% | 15,603 | 15,637 |
| Active Idle | 0 | 0 | |