SPECpower_ssj2008
Host 'sl2x170z-node3' Performance Report
Copyright © 2007-2010 Standard Performance Evaluation Corporation
| Hewlett-Packard Company ProLiant SL2x170z G6 | ssj_ops@100% = 726,994 ssj_ops@100% per JVM = 121,166 |
||||
| Test Sponsor: | Hewlett-Packard Company | SPEC License #: | 3 | Test Method: | Multi Node |
| Tested By: | Hewlett-Packard Company | Test Location: | Houston, TX, USA | Test Date: | Jun 1, 2010 |
| Hardware Availability: | Jun-2010 | Software Availability: | Sep-2009 | Publication: | Jun 17, 2010 |
| System Source: | Single Supplier | System Designation: | Server | Power Provisioning: | Line-powered |
| Target Load | Actual Load | ssj_ops | |
|---|---|---|---|
| Target | Actual | ||
| Calibration 1 | 721,251 | ||
| Calibration 2 | 728,418 | ||
| Calibration 3 | 726,027 | ||
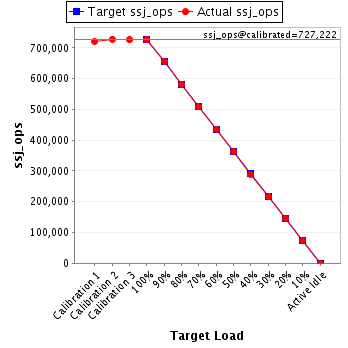
| ssj_ops@calibrated=727,222 | |||
| 100% | 100.0% | 727,222 | 726,994 |
| 90% | 90.2% | 654,500 | 655,891 |
| 80% | 79.8% | 581,778 | 580,543 |
| 70% | 70.0% | 509,056 | 509,240 |
| 60% | 60.0% | 436,333 | 436,036 |
| 50% | 50.1% | 363,611 | 364,291 |
| 40% | 39.8% | 290,889 | 289,749 |
| 30% | 29.9% | 218,167 | 217,704 |
| 20% | 20.0% | 145,444 | 145,722 |
| 10% | 10.0% | 72,722 | 72,806 |
| Active Idle | 0 | 0 | |
| Set Identifier: | sut |
| Set Description: | ProLiant SL2x170z G6 |
| # of Identical Nodes: | 4 |
| Comment: | None |
| Hardware | |
|---|---|
| Hardware Vendor: | Hewlett-Packard Company |
| Model: | ProLiant SL2x170z G6 |
| Form Factor: | 1U |
| CPU Name: | Intel Xeon L5640 |
| CPU Characteristics: | Six-Core, 2.27 GHz, 12 MB L3 cache |
| CPU Frequency (MHz): | 2267 |
| CPU(s) Enabled: | 12 cores, 2 chips, 6 cores/chip |
| Hardware Threads: | 24 (2 / core) |
| CPU(s) Orderable: | 1,2 chips |
| Primary Cache: | 32 KB I + 32 KB D on chip per core |
| Secondary Cache: | 256 MB I+D on chip per chip |
| Tertiary Cache: | 12 MB I+D off chip per chip |
| Other Cache: | None |
| Memory Amount (GB): | 16 |
| # and size of DIMM: | 4 x 4096 MB |
| Memory Details: | 4GB PC3L-10600E; slots 1 and 4 are populated on each processor |
| Power Supply Quantity and Rating (W): | None |
| Power Supply Details: | Shared |
| Disk Drive: | 1 x 60GB 3G SATA 2.5in QR MDL SSD, HP part #586585-B21 |
| Disk Controller: | Integrated SATA |
| # and type of Network Interface Cards (NICs) Installed: | 1 x NC362i Dual Port Multifunction Gigabit Server Adapters |
| NICs Enabled in Firmware / OS / Connected: | 2/2/1 |
| Network Speed (Mbit): | 1000 |
| Keyboard: | None |
| Mouse: | None |
| Monitor: | None |
| Optical Drives: | No |
| Other Hardware: | None |
| Software | |
|---|---|
| Power Management: | Power Saver in OS |
| Operating System (OS): | Windows Server 2008, Enterprise Edition |
| OS Version: | R2 |
| Filesystem: | NTFS |
| JVM Vendor: | IBM Corporation |
| JVM Version: | IBM J9 VM (build 2.4, J2RE 1.6.0 IBM J9 2.4 Windows Server 2008 amd64-64 jvmwa660sr5-20090519_35743 (JIT enabled, AOT enabled) |
| JVM Command-line Options: | -Xaggressive -Xcompressedrefs -Xgcpolicy:gencon -Xmn1500m -Xms1900m -Xmx1900m -XlockReservation -Xnoloa -XtlhPrefetch -Xlp |
| JVM Affinity: | start /affinity [0xF, 0xF0, 0xF00, 0xF000, 0xF0000, 0xF00000] |
| JVM Instances: | 6 |
| JVM Initial Heap (MB): | 1900 |
| JVM Maximum Heap (MB): | 1900 |
| JVM Address Bits: | 64 |
| Boot Firmware Version: | O34 04/02/2010 |
| Management Firmware Version: | 4.20 1/13/10 |
| Workload Version: | SSJ 1.2.6 |
| Director Location: | Controller |
| Other Software: | None |
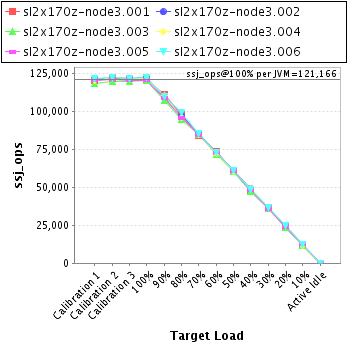
| JVM Instance | ssj_ops@100% |
|---|---|
| sl2x170z-node3.001 | 120,899 |
| sl2x170z-node3.002 | 122,129 |
| sl2x170z-node3.003 | 120,051 |
| sl2x170z-node3.004 | 121,560 |
| sl2x170z-node3.005 | 120,400 |
| sl2x170z-node3.006 | 121,956 |
| ssj_ops@100% | 726,994 |
| ssj_ops@100% per JVM | 121,166 |
| Target Load | Actual Load | ssj_ops | |
|---|---|---|---|
| Target | Actual | ||
| Calibration 1 | 120,418 | ||
| Calibration 2 | 121,296 | ||
| Calibration 3 | 121,626 | ||
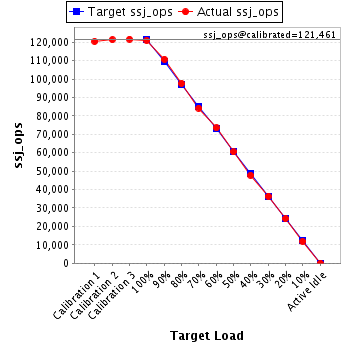
| ssj_ops@calibrated=121,461 | |||
| 100% | 99.5% | 121,461 | 120,899 |
| 90% | 91.2% | 109,315 | 110,740 |
| 80% | 80.4% | 97,169 | 97,600 |
| 70% | 69.3% | 85,023 | 84,183 |
| 60% | 60.5% | 72,877 | 73,449 |
| 50% | 49.7% | 60,730 | 60,413 |
| 40% | 39.3% | 48,584 | 47,780 |
| 30% | 29.9% | 36,438 | 36,343 |
| 20% | 19.9% | 24,292 | 24,207 |
| 10% | 9.8% | 12,146 | 11,868 |
| Active Idle | 0 | 0 | |
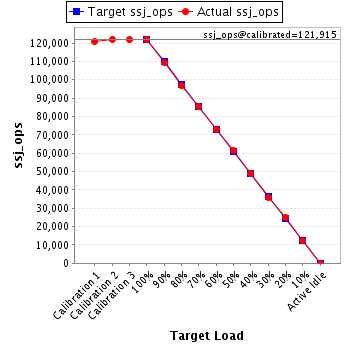
| Target Load | Actual Load | ssj_ops | |
|---|---|---|---|
| Target | Actual | ||
| Calibration 1 | 120,958 | ||
| Calibration 2 | 122,031 | ||
| Calibration 3 | 121,800 | ||
| ssj_ops@calibrated=121,915 | |||
| 100% | 100.2% | 121,915 | 122,129 |
| 90% | 89.7% | 109,724 | 109,361 |
| 80% | 79.5% | 97,532 | 96,900 |
| 70% | 70.0% | 85,341 | 85,395 |
| 60% | 59.9% | 73,149 | 73,059 |
| 50% | 50.2% | 60,958 | 61,203 |
| 40% | 40.1% | 48,766 | 48,939 |
| 30% | 29.5% | 36,575 | 35,966 |
| 20% | 20.4% | 24,383 | 24,926 |
| 10% | 10.0% | 12,192 | 12,208 |
| Active Idle | 0 | 0 | |
| Target Load | Actual Load | ssj_ops | |
|---|---|---|---|
| Target | Actual | ||
| Calibration 1 | 118,188 | ||
| Calibration 2 | 119,742 | ||
| Calibration 3 | 119,483 | ||
| ssj_ops@calibrated=119,612 | |||
| 100% | 100.4% | 119,612 | 120,051 |
| 90% | 89.4% | 107,651 | 106,905 |
| 80% | 79.2% | 95,690 | 94,733 |
| 70% | 70.9% | 83,728 | 84,838 |
| 60% | 59.7% | 71,767 | 71,358 |
| 50% | 50.2% | 59,806 | 60,096 |
| 40% | 39.6% | 47,845 | 47,317 |
| 30% | 30.1% | 35,884 | 36,014 |
| 20% | 19.5% | 23,922 | 23,317 |
| 10% | 10.0% | 11,961 | 11,937 |
| Active Idle | 0 | 0 | |

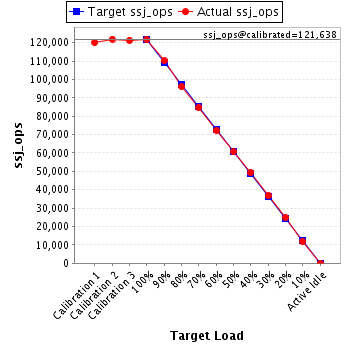
| Target Load | Actual Load | ssj_ops | |
|---|---|---|---|
| Target | Actual | ||
| Calibration 1 | 120,045 | ||
| Calibration 2 | 121,910 | ||
| Calibration 3 | 121,366 | ||
| ssj_ops@calibrated=121,638 | |||
| 100% | 99.9% | 121,638 | 121,560 |
| 90% | 90.6% | 109,474 | 110,169 |
| 80% | 79.1% | 97,310 | 96,165 |
| 70% | 69.8% | 85,147 | 84,915 |
| 60% | 59.4% | 72,983 | 72,301 |
| 50% | 49.9% | 60,819 | 60,678 |
| 40% | 40.6% | 48,655 | 49,423 |
| 30% | 30.2% | 36,491 | 36,710 |
| 20% | 20.4% | 24,328 | 24,833 |
| 10% | 9.8% | 12,164 | 11,909 |
| Active Idle | 0 | 0 | |
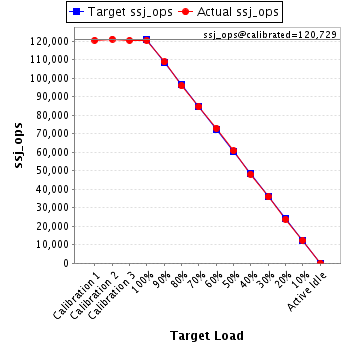
| Target Load | Actual Load | ssj_ops | |
|---|---|---|---|
| Target | Actual | ||
| Calibration 1 | 120,421 | ||
| Calibration 2 | 121,038 | ||
| Calibration 3 | 120,419 | ||
| ssj_ops@calibrated=120,729 | |||
| 100% | 99.7% | 120,729 | 120,400 |
| 90% | 90.0% | 108,656 | 108,713 |
| 80% | 79.4% | 96,583 | 95,824 |
| 70% | 70.0% | 84,510 | 84,559 |
| 60% | 60.4% | 72,437 | 72,908 |
| 50% | 50.3% | 60,364 | 60,728 |
| 40% | 39.8% | 48,292 | 48,039 |
| 30% | 29.7% | 36,219 | 35,868 |
| 20% | 19.7% | 24,146 | 23,739 |
| 10% | 10.2% | 12,073 | 12,370 |
| Active Idle | 0 | 0 | |
| Target Load | Actual Load | ssj_ops | |
|---|---|---|---|
| Target | Actual | ||
| Calibration 1 | 121,221 | ||
| Calibration 2 | 122,401 | ||
| Calibration 3 | 121,333 | ||
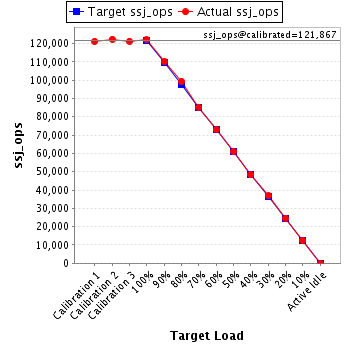
| ssj_ops@calibrated=121,867 | |||
| 100% | 100.1% | 121,867 | 121,956 |
| 90% | 90.3% | 109,680 | 110,003 |
| 80% | 81.5% | 97,494 | 99,321 |
| 70% | 70.0% | 85,307 | 85,350 |
| 60% | 59.9% | 73,120 | 72,961 |
| 50% | 50.2% | 60,933 | 61,173 |
| 40% | 39.6% | 48,747 | 48,250 |
| 30% | 30.2% | 36,560 | 36,803 |
| 20% | 20.3% | 24,373 | 24,699 |
| 10% | 10.3% | 12,187 | 12,512 |
| Active Idle | 0 | 0 | |