SPECpower_ssj2008
Host 'sl2x170z-node2' Performance Report
Copyright © 2007-2010 Standard Performance Evaluation Corporation
| Hewlett-Packard Company ProLiant SL2x170z G6 | ssj_ops@100% = 719,572 ssj_ops@100% per JVM = 119,929 |
||||
| Test Sponsor: | Hewlett-Packard Company | SPEC License #: | 3 | Test Method: | Multi Node |
| Tested By: | Hewlett-Packard Company | Test Location: | Houston, TX, USA | Test Date: | Jun 1, 2010 |
| Hardware Availability: | Jun-2010 | Software Availability: | Sep-2009 | Publication: | Jun 17, 2010 |
| System Source: | Single Supplier | System Designation: | Server | Power Provisioning: | Line-powered |
| Target Load | Actual Load | ssj_ops | |
|---|---|---|---|
| Target | Actual | ||
| Calibration 1 | 718,926 | ||
| Calibration 2 | 720,857 | ||
| Calibration 3 | 722,200 | ||
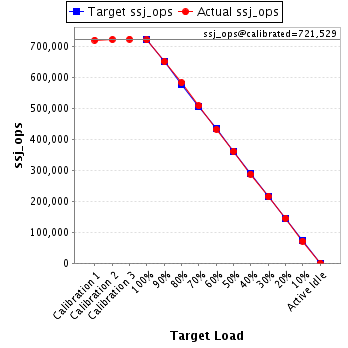
| ssj_ops@calibrated=721,529 | |||
| 100% | 99.7% | 721,529 | 719,572 |
| 90% | 90.1% | 649,376 | 650,031 |
| 80% | 80.6% | 577,223 | 581,797 |
| 70% | 70.3% | 505,070 | 507,067 |
| 60% | 59.9% | 432,917 | 431,865 |
| 50% | 50.0% | 360,764 | 360,804 |
| 40% | 39.8% | 288,612 | 287,271 |
| 30% | 29.8% | 216,459 | 215,178 |
| 20% | 20.1% | 144,306 | 145,219 |
| 10% | 9.9% | 72,153 | 71,288 |
| Active Idle | 0 | 0 | |
| Set Identifier: | sut |
| Set Description: | ProLiant SL2x170z G6 |
| # of Identical Nodes: | 4 |
| Comment: | None |
| Hardware | |
|---|---|
| Hardware Vendor: | Hewlett-Packard Company |
| Model: | ProLiant SL2x170z G6 |
| Form Factor: | 1U |
| CPU Name: | Intel Xeon L5640 |
| CPU Characteristics: | Six-Core, 2.27 GHz, 12 MB L3 cache |
| CPU Frequency (MHz): | 2267 |
| CPU(s) Enabled: | 12 cores, 2 chips, 6 cores/chip |
| Hardware Threads: | 24 (2 / core) |
| CPU(s) Orderable: | 1,2 chips |
| Primary Cache: | 32 KB I + 32 KB D on chip per core |
| Secondary Cache: | 256 MB I+D on chip per chip |
| Tertiary Cache: | 12 MB I+D off chip per chip |
| Other Cache: | None |
| Memory Amount (GB): | 16 |
| # and size of DIMM: | 4 x 4096 MB |
| Memory Details: | 4GB PC3L-10600E; slots 1 and 4 are populated on each processor |
| Power Supply Quantity and Rating (W): | None |
| Power Supply Details: | Shared |
| Disk Drive: | 1 x 60GB 3G SATA 2.5in QR MDL SSD, HP part #586585-B21 |
| Disk Controller: | Integrated SATA |
| # and type of Network Interface Cards (NICs) Installed: | 1 x NC362i Dual Port Multifunction Gigabit Server Adapters |
| NICs Enabled in Firmware / OS / Connected: | 2/2/1 |
| Network Speed (Mbit): | 1000 |
| Keyboard: | None |
| Mouse: | None |
| Monitor: | None |
| Optical Drives: | No |
| Other Hardware: | None |
| Software | |
|---|---|
| Power Management: | Power Saver in OS |
| Operating System (OS): | Windows Server 2008, Enterprise Edition |
| OS Version: | R2 |
| Filesystem: | NTFS |
| JVM Vendor: | IBM Corporation |
| JVM Version: | IBM J9 VM (build 2.4, J2RE 1.6.0 IBM J9 2.4 Windows Server 2008 amd64-64 jvmwa660sr5-20090519_35743 (JIT enabled, AOT enabled) |
| JVM Command-line Options: | -Xaggressive -Xcompressedrefs -Xgcpolicy:gencon -Xmn1500m -Xms1900m -Xmx1900m -XlockReservation -Xnoloa -XtlhPrefetch -Xlp |
| JVM Affinity: | start /affinity [0xF, 0xF0, 0xF00, 0xF000, 0xF0000, 0xF00000] |
| JVM Instances: | 6 |
| JVM Initial Heap (MB): | 1900 |
| JVM Maximum Heap (MB): | 1900 |
| JVM Address Bits: | 64 |
| Boot Firmware Version: | O34 04/02/2010 |
| Management Firmware Version: | 4.20 1/13/10 |
| Workload Version: | SSJ 1.2.6 |
| Director Location: | Controller |
| Other Software: | None |
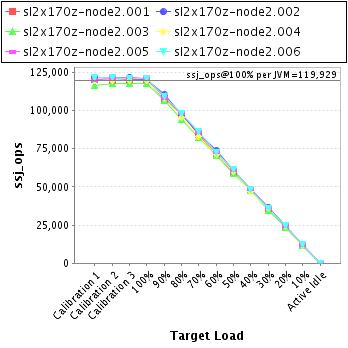
| JVM Instance | ssj_ops@100% |
|---|---|
| sl2x170z-node2.001 | 119,984 |
| sl2x170z-node2.002 | 120,522 |
| sl2x170z-node2.003 | 117,819 |
| sl2x170z-node2.004 | 119,356 |
| sl2x170z-node2.005 | 121,250 |
| sl2x170z-node2.006 | 120,641 |
| ssj_ops@100% | 719,572 |
| ssj_ops@100% per JVM | 119,929 |
| Target Load | Actual Load | ssj_ops | |
|---|---|---|---|
| Target | Actual | ||
| Calibration 1 | 120,155 | ||
| Calibration 2 | 119,610 | ||
| Calibration 3 | 120,504 | ||
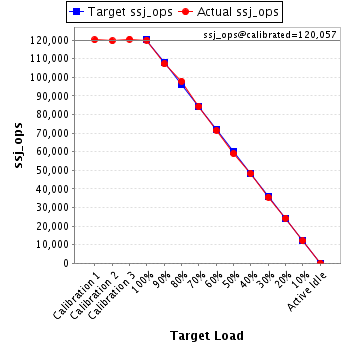
| ssj_ops@calibrated=120,057 | |||
| 100% | 99.9% | 120,057 | 119,984 |
| 90% | 89.3% | 108,051 | 107,200 |
| 80% | 81.5% | 96,046 | 97,878 |
| 70% | 70.2% | 84,040 | 84,321 |
| 60% | 59.5% | 72,034 | 71,457 |
| 50% | 49.1% | 60,028 | 58,941 |
| 40% | 40.1% | 48,023 | 48,130 |
| 30% | 29.7% | 36,017 | 35,597 |
| 20% | 20.2% | 24,011 | 24,249 |
| 10% | 10.0% | 12,006 | 12,062 |
| Active Idle | 0 | 0 | |
| Target Load | Actual Load | ssj_ops | |
|---|---|---|---|
| Target | Actual | ||
| Calibration 1 | 121,315 | ||
| Calibration 2 | 121,360 | ||
| Calibration 3 | 121,820 | ||
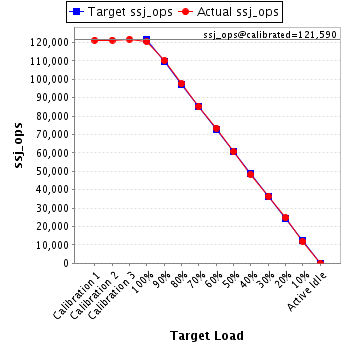
| ssj_ops@calibrated=121,590 | |||
| 100% | 99.1% | 121,590 | 120,522 |
| 90% | 90.6% | 109,431 | 110,185 |
| 80% | 80.2% | 97,272 | 97,525 |
| 70% | 70.1% | 85,113 | 85,240 |
| 60% | 60.5% | 72,954 | 73,518 |
| 50% | 49.9% | 60,795 | 60,613 |
| 40% | 39.6% | 48,636 | 48,155 |
| 30% | 29.9% | 36,477 | 36,399 |
| 20% | 20.3% | 24,318 | 24,652 |
| 10% | 9.6% | 12,159 | 11,733 |
| Active Idle | 0 | 0 | |
| Target Load | Actual Load | ssj_ops | |
|---|---|---|---|
| Target | Actual | ||
| Calibration 1 | 116,527 | ||
| Calibration 2 | 117,927 | ||
| Calibration 3 | 117,453 | ||
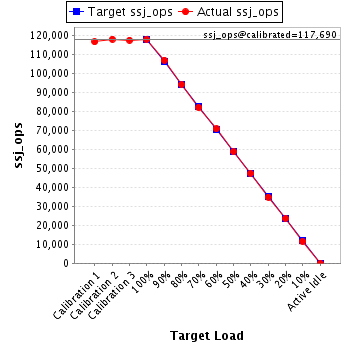
| ssj_ops@calibrated=117,690 | |||
| 100% | 100.1% | 117,690 | 117,819 |
| 90% | 90.8% | 105,921 | 106,875 |
| 80% | 79.9% | 94,152 | 94,058 |
| 70% | 69.7% | 82,383 | 82,056 |
| 60% | 60.1% | 70,614 | 70,750 |
| 50% | 49.9% | 58,845 | 58,687 |
| 40% | 40.3% | 47,076 | 47,375 |
| 30% | 29.6% | 35,307 | 34,868 |
| 20% | 20.0% | 23,538 | 23,594 |
| 10% | 9.9% | 11,769 | 11,608 |
| Active Idle | 0 | 0 | |
| Target Load | Actual Load | ssj_ops | |
|---|---|---|---|
| Target | Actual | ||
| Calibration 1 | 119,396 | ||
| Calibration 2 | 119,404 | ||
| Calibration 3 | 119,650 | ||
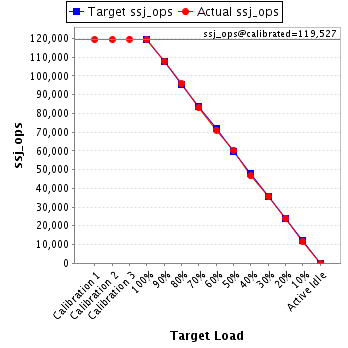
| ssj_ops@calibrated=119,527 | |||
| 100% | 99.9% | 119,527 | 119,356 |
| 90% | 90.2% | 107,574 | 107,838 |
| 80% | 80.1% | 95,622 | 95,743 |
| 70% | 69.7% | 83,669 | 83,258 |
| 60% | 59.5% | 71,716 | 71,140 |
| 50% | 50.5% | 59,763 | 60,392 |
| 40% | 39.1% | 47,811 | 46,739 |
| 30% | 29.9% | 35,858 | 35,739 |
| 20% | 20.0% | 23,905 | 23,936 |
| 10% | 9.9% | 11,953 | 11,849 |
| Active Idle | 0 | 0 | |
| Target Load | Actual Load | ssj_ops | |
|---|---|---|---|
| Target | Actual | ||
| Calibration 1 | 120,177 | ||
| Calibration 2 | 121,022 | ||
| Calibration 3 | 121,657 | ||
| ssj_ops@calibrated=121,340 | |||
| 100% | 99.9% | 121,340 | 121,250 |
| 90% | 89.4% | 109,206 | 108,464 |
| 80% | 81.0% | 97,072 | 98,290 |
| 70% | 70.8% | 84,938 | 85,870 |
| 60% | 59.9% | 72,804 | 72,648 |
| 50% | 50.2% | 60,670 | 60,955 |
| 40% | 40.2% | 48,536 | 48,804 |
| 30% | 30.2% | 36,402 | 36,618 |
| 20% | 20.1% | 24,268 | 24,362 |
| 10% | 9.9% | 12,134 | 11,991 |
| Active Idle | 0 | 0 | |

| Target Load | Actual Load | ssj_ops | |
|---|---|---|---|
| Target | Actual | ||
| Calibration 1 | 121,356 | ||
| Calibration 2 | 121,535 | ||
| Calibration 3 | 121,117 | ||
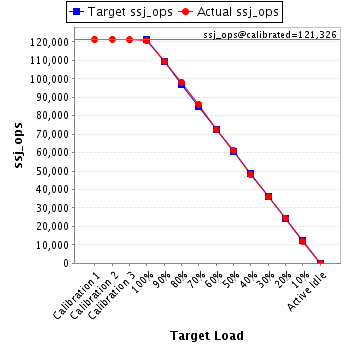
| ssj_ops@calibrated=121,326 | |||
| 100% | 99.4% | 121,326 | 120,641 |
| 90% | 90.2% | 109,193 | 109,469 |
| 80% | 81.0% | 97,060 | 98,302 |
| 70% | 71.1% | 84,928 | 86,323 |
| 60% | 59.6% | 72,795 | 72,351 |
| 50% | 50.5% | 60,663 | 61,217 |
| 40% | 39.6% | 48,530 | 48,067 |
| 30% | 29.6% | 36,398 | 35,957 |
| 20% | 20.1% | 24,265 | 24,427 |
| 10% | 9.9% | 12,133 | 12,045 |
| Active Idle | 0 | 0 | |