SPECpower_ssj2008
Host 'node4' Performance Report
Copyright © 2007-2009 Standard Performance Evaluation Corporation
| Hewlett-Packard Company ProLiant SL2x170z G6 (2.4 GHz, Intel Xeon L5530) | ssj_ops@100% = 529,152 ssj_ops@100% per JVM = 132,288 |
||||
| Test Sponsor: | Hewlett-Packard Company | SPEC License #: | 3 | Test Method: | Multi Node |
| Tested By: | Hewlett-Packard Company | Test Location: | Houston, TX, USA | Test Date: | Sep 3, 2009 |
| Hardware Availability: | Oct-2009 | Software Availability: | Jul-2009 | Publication: | Nov 4, 2009 |
| System Source: | Single Supplier | System Designation: | Server | Power Provisioning: | Line-powered |
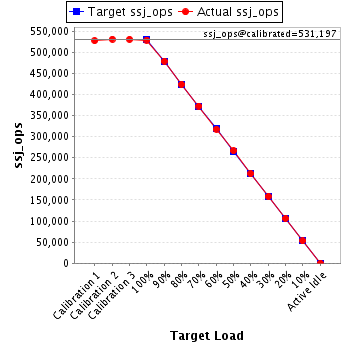
| Target Load | Actual Load | ssj_ops | |
|---|---|---|---|
| Target | Actual | ||
| Calibration 1 | 527,626 | ||
| Calibration 2 | 531,243 | ||
| Calibration 3 | 531,150 | ||
| ssj_ops@calibrated=531,197 | |||
| 100% | 99.6% | 531,197 | 529,152 |
| 90% | 90.2% | 478,077 | 479,186 |
| 80% | 79.8% | 424,957 | 424,023 |
| 70% | 70.2% | 371,838 | 372,752 |
| 60% | 59.8% | 318,718 | 317,851 |
| 50% | 50.2% | 265,598 | 266,606 |
| 40% | 39.9% | 212,479 | 212,204 |
| 30% | 29.9% | 159,359 | 158,648 |
| 20% | 20.0% | 106,239 | 106,363 |
| 10% | 10.0% | 53,120 | 52,998 |
| Active Idle | 0 | 0 | |
| Set Identifier: | sut |
| Set Description: | ProLiant SL2x170z G6 |
| # of Identical Nodes: | 4 |
| Comment: | None |
| Hardware | |
|---|---|
| Hardware Vendor: | Hewlett-Packard Company |
| Model: | ProLiant SL2x170z G6 (2.4 GHz, Intel Xeon L5530) |
| Form Factor: | 2U |
| CPU Name: | Intel Xeon L5530 |
| CPU Characteristics: | Quad-Core, 2.40 GHz, 8 MB L3 cache |
| CPU Frequency (MHz): | 2400 |
| CPU(s) Enabled: | 8 cores, 2 chips, 4 cores/chip |
| Hardware Threads: | 16 (2 / core) |
| CPU(s) Orderable: | 1,2 chips |
| Primary Cache: | 32 KB I + 32 KB D on chip per core |
| Secondary Cache: | 256 KB I+D on chip per core |
| Tertiary Cache: | 8 MB I+D on chip per chip |
| Other Cache: | None |
| Memory Amount (GB): | 8 |
| # and size of DIMM: | 4 x 2048 MB |
| Memory Details: | 2GB 2Rx8 PC3-10600E; slots 1 and 4 are populated on each processor |
| Power Supply Quantity and Rating (W): | None |
| Power Supply Details: | Shared |
| Disk Drive: | 1 x 60GB SSD 2.5" SATA, HP part #:586585-B21 |
| Disk Controller: | Integrated SATA |
| # and type of Network Interface Cards (NICs) Installed: | 2 x HP NC362i Dual Port Multifunction Gigabit Server Adapters |
| NICs Enabled in Firmware / OS / Connected: | 2/2/1 |
| Network Speed (Mbit): | 1000 |
| Keyboard: | None |
| Mouse: | None |
| Monitor: | None |
| Optical Drives: | No |
| Other Hardware: | None |
| Software | |
|---|---|
| Power Management: | Power saver plan in OS |
| Operating System (OS): | Windows Server 2008 x64, Enterprise Edition |
| OS Version: | SP2 |
| Filesystem: | NTFS |
| JVM Vendor: | IBM Corporation |
| JVM Version: | IBM J9 VM (build 2.4, J2RE 1.6.0 IBM J9 2.4 Windows Server 2008 amd64-64 jvmwa6460sr5-20090519_35743 (JIT enabled, AOT enabled) |
| JVM Command-line Options: | -Xaggressive -Xcompressedrefs -Xgcpolicy:gencon -Xmn1100m -Xms1600m -Xmx1600m -XlockReservation -Xnoloa -XtlhPrefetch -Xlp -Xgcthreads4 |
| JVM Affinity: | start /affinity [0xF, 0xF0, 0xF00, 0xF000] |
| JVM Instances: | 4 |
| JVM Initial Heap (MB): | 1600 |
| JVM Maximum Heap (MB): | 1600 |
| JVM Address Bits: | 64 |
| Boot Firmware Version: | O34 8/25/09 |
| Management Firmware Version: | 4.04 7/1/09 |
| Workload Version: | SSJ 1.2.6 |
| Director Location: | Controller |
| Other Software: | NIC driver, HP component cp010296.exe. Driver version: 10.3.49.400 |
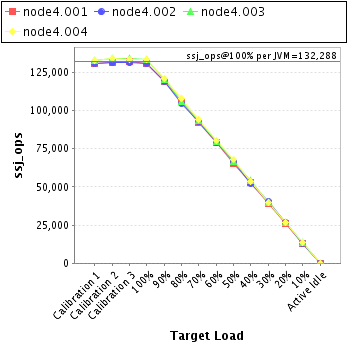
| JVM Instance | ssj_ops@100% |
|---|---|
| node4.001 | 130,991 |
| node4.002 | 130,954 |
| node4.003 | 133,676 |
| node4.004 | 133,531 |
| ssj_ops@100% | 529,152 |
| ssj_ops@100% per JVM | 132,288 |
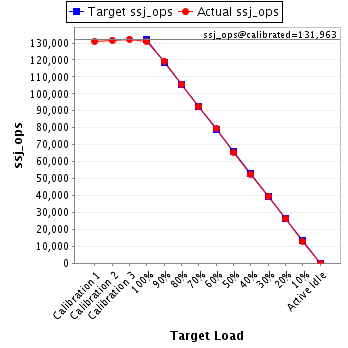
| Target Load | Actual Load | ssj_ops | |
|---|---|---|---|
| Target | Actual | ||
| Calibration 1 | 131,019 | ||
| Calibration 2 | 131,647 | ||
| Calibration 3 | 132,279 | ||
| ssj_ops@calibrated=131,963 | |||
| 100% | 99.3% | 131,963 | 130,991 |
| 90% | 90.4% | 118,767 | 119,259 |
| 80% | 80.1% | 105,571 | 105,736 |
| 70% | 70.0% | 92,374 | 92,375 |
| 60% | 60.1% | 79,178 | 79,355 |
| 50% | 49.7% | 65,982 | 65,604 |
| 40% | 39.9% | 52,785 | 52,685 |
| 30% | 29.9% | 39,589 | 39,419 |
| 20% | 19.8% | 26,393 | 26,158 |
| 10% | 9.8% | 13,196 | 12,966 |
| Active Idle | 0 | 0 | |
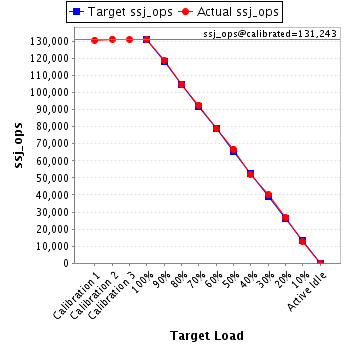
| Target Load | Actual Load | ssj_ops | |
|---|---|---|---|
| Target | Actual | ||
| Calibration 1 | 130,770 | ||
| Calibration 2 | 131,305 | ||
| Calibration 3 | 131,181 | ||
| ssj_ops@calibrated=131,243 | |||
| 100% | 99.8% | 131,243 | 130,954 |
| 90% | 90.5% | 118,119 | 118,826 |
| 80% | 79.8% | 104,994 | 104,674 |
| 70% | 70.6% | 91,870 | 92,634 |
| 60% | 60.0% | 78,746 | 78,790 |
| 50% | 50.9% | 65,622 | 66,769 |
| 40% | 39.7% | 52,497 | 52,119 |
| 30% | 30.6% | 39,373 | 40,108 |
| 20% | 20.3% | 26,249 | 26,590 |
| 10% | 9.9% | 13,124 | 12,954 |
| Active Idle | 0 | 0 | |
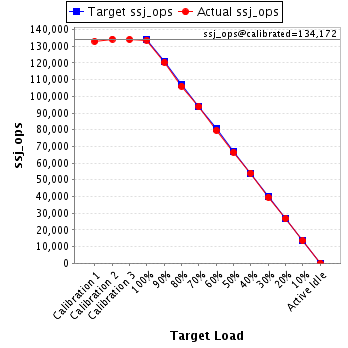
| Target Load | Actual Load | ssj_ops | |
|---|---|---|---|
| Target | Actual | ||
| Calibration 1 | 132,961 | ||
| Calibration 2 | 134,257 | ||
| Calibration 3 | 134,087 | ||
| ssj_ops@calibrated=134,172 | |||
| 100% | 99.6% | 134,172 | 133,676 |
| 90% | 89.7% | 120,755 | 120,391 |
| 80% | 79.0% | 107,338 | 106,044 |
| 70% | 69.9% | 93,920 | 93,743 |
| 60% | 59.3% | 80,503 | 79,593 |
| 50% | 49.6% | 67,086 | 66,543 |
| 40% | 40.2% | 53,669 | 53,983 |
| 30% | 29.5% | 40,252 | 39,582 |
| 20% | 20.0% | 26,834 | 26,778 |
| 10% | 10.1% | 13,417 | 13,554 |
| Active Idle | 0 | 0 | |
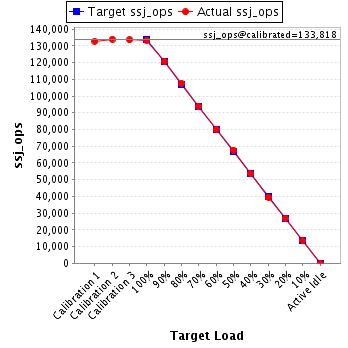
| Target Load | Actual Load | ssj_ops | |
|---|---|---|---|
| Target | Actual | ||
| Calibration 1 | 132,875 | ||
| Calibration 2 | 134,034 | ||
| Calibration 3 | 133,603 | ||
| ssj_ops@calibrated=133,818 | |||
| 100% | 99.8% | 133,818 | 133,531 |
| 90% | 90.2% | 120,437 | 120,710 |
| 80% | 80.4% | 107,055 | 107,569 |
| 70% | 70.2% | 93,673 | 94,000 |
| 60% | 59.9% | 80,291 | 80,112 |
| 50% | 50.6% | 66,909 | 67,690 |
| 40% | 39.9% | 53,527 | 53,418 |
| 30% | 29.5% | 40,146 | 39,539 |
| 20% | 20.1% | 26,764 | 26,837 |
| 10% | 10.1% | 13,382 | 13,524 |
| Active Idle | 0 | 0 | |