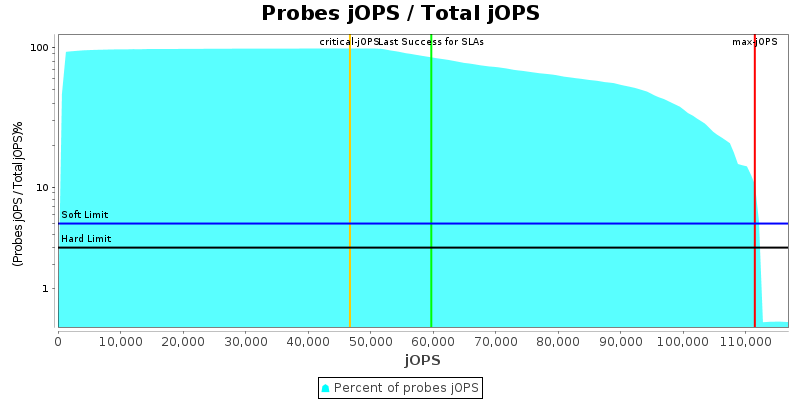
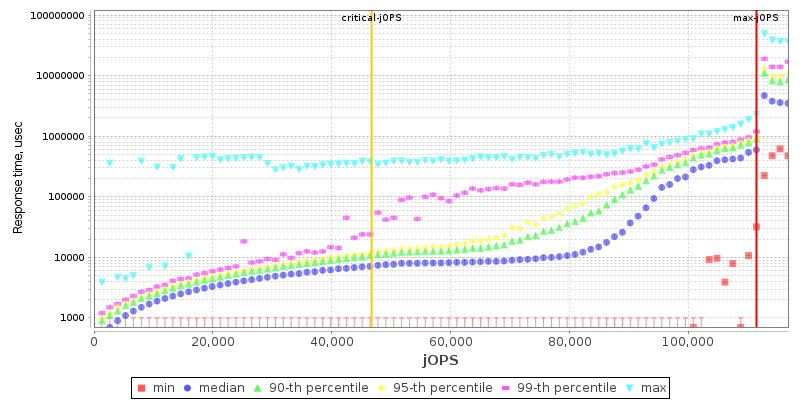
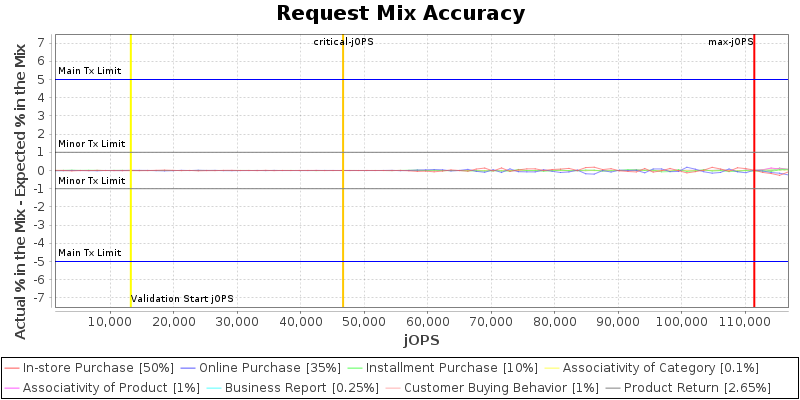
Super Micro Computer, Inc Supermicro Model H12SSFF-AN6 111448 SPECjbb2015-MultiJVM max-jOPS
46694 SPECjbb2015-MultiJVM critical-jOPS
Tested by: Super Micro Computer, Inc Test Sponsor: Super Micro Computer, Inc Test location: San Jose, California Test date: February 23, 2022
SPEC license #: 001176 Hardware Availability: Feb-2021 Software Availability: Oct-2021 Publication: Mon Mar 21 09:10:57 EDT 2022
Benchmark Results Summary
 
Overall Throughput RT curve
Overall SUT (System Under Test) Description
VendorSuper Micro Computer, Inc
Vendor URLhttps://www.supermicro.com
System SourceSingle Supplier
System DesignationServer Rack
Total Systems1
All SUT Systems IdenticalYES
Total Nodes1
All Nodes IdenticalYES
Nodes Per System1
Total Chips1
Total Cores24
Total Threads48
Total Memory Amount (GB)512
Total OS Images1
SW EnvironmentNon-virtual
 
Hardware hw_1
NameA+ Server F1114S-FT
VendorSuper Mciro Computer, Inc
Vendor URLhttp://www.supermicro.com/
AvailableMar-2022
ModelH12SSFF-AN6
Form Factor1U
CPU NameAMD EPYC 7473X
CPU Characteristics24 core, 2.80 GHz, 768 MB L3 Cache (Max Boost Clock up to 3.70 GHz)
Number of Systems1
Nodes Per System1
Chips Per System1
Cores Per System24
Cores Per Chip24
Threads Per System48
Threads Per Core48
Version2.3 (10/21/2021)
CPU Frequency (MHz)2800
Primary Cache32 KB I + 32 KB D on chip per core
Secondary Cache512 KB I+D on chip per core
Tertiary Cache768 MB (I+D) on chip per chip
Other CacheNone
Disk1 x 240 GB SATA SSD
File Systemext4
Memory Amount (GB)512
# and size of DIMM(s)SK Hynix
Memory Details64GB 2Rx4 PC4-3200AA-RB4-12-DC1
# and type of Network Interface Cards (NICs)2 x 1 GbE NIC
Power Supply Quantity and Rating (W)1 x 2000w
Other HardwareNone
Cabinet/Housing/EnclosureNone
Shared DescriptionNone
Shared CommentNone
NotesNone
Other Hardware network_1
NameNone
VendorNone
Vendor URLNone
VersionNone
AvailableNone
BitnessNone
NotesNone
Operating System os_1
NameRed Hat Enterprise Linux 8.3
VendorRed Hat
Vendor URLhttps://access.redhat.com/
Version4.18.0-240.el8.x86_64
AvailableOct-2020
Bitness64
NotesNone
Java Virtual Machine jvm_1
NameOracle java SE 17.0.2
VendorOracle
Vendor URLhttp://www.oracle.com
VersionJDK HotSpot 64-bit Server VM, version 17.0.2
AvailableDec-2021
Bitness64
Notesnote
Other Software other_1
NameNone
VendorNone
Vendor URLnone
VersionNone
AvailableNone
BitnessNone
NotesNone
Hardware
OS Images os_Image_1(1)
Hardware Description hw_1
Number of Systems 1
SW Environment non-virtual
Tuning tuning
Notes notes
OS Image os_Image_1
JVM Instances jvm_Ctr_1(1), jvm_Backend_1(8), jvm_TxInjector_1(8)
OS Image Description os_1
Tuning

  • echo 10000 > /proc/sys/kernel/sched_cfs_bandwidth_slice_us
  • echo 0 > /proc/sys/kernel/sched_child_runs_first
  • echo 16000000 > /proc/sys/kernel/sched_latency_ns
  • echo 1000 > /proc/sys/kernel/sched_migration_cost_ns
  • echo 28000000 > /proc/sys/kernel/sched_min_granularity_ns
  • echo 9 > /proc/sys/kernel/sched_nr_migrate
  • echo 100 > /proc/sys/kernel/sched_rr_timeslice_ms
  • echo 1000000 > /proc/sys/kernel/sched_rt_period_us
  • echo 990000 > /proc/sys/kernel/sched_rt_runtime_us
  • echo 0 > /proc/sys/kernel/sched_schedstats
  • echo 1 > /proc/sys/kernel/sched_tunable_scaling
  • echo 50000000 > /proc/sys/kernel/sched_wakeup_granularity_ns
  • echo 3000 > /proc/sys/vm/dirty_expire_centisecs
  • echo 500 > /proc/sys/vm/dirty_writeback_centisecs
  • echo 40 > /proc/sys/vm/dirty_ratio
  • echo 10 > /proc/sys/vm/dirty_background_ratio
  • echo 10 > /proc/sys/vm/swappiness
  • echo 0 > /proc/sys/vm/numa_stat
  • echo 0 > /proc/sys/kernel/numa_balancing
  • echo always > /sys/kernel/mm/transparent_hugepage/defrag
  • echo always > /sys/kernel/mm/transparent_hugepage/enabled

Notes None
JVM Instance jvm_Ctr_1
Parts of Benchmark Controller
JVM Instance Description jvm_1
Command Line

-Xms2g -Xmx2g -Xmn1536m -XX:+UseParallelGC -XX:CICompilerCount=2 -XX:ParallelGCThreads=2

Tuning None
Notes

Used numactl to interleave memory on all NUMA nodes

  • numactl --interleave=all

JVM Instance jvm_Backend_1
Parts of Benchmark Backend
JVM Instance Description jvm_1
Command Line

-Xms32736M -Xmx32736M -Xmn31736M -XX:-UseDynamicNumberOfGCThreads -XX:CICompilerCount=32 -XX:AllocatePrefetchInstr=2 -XX:+UseParallelGC -XX:ParallelGCThreads=32 -XX:LargePageSizeInBytes=2m -XX:-UseAdaptiveSizePolicy -XX:+AlwaysPreTouch -XX:-UseBiasedLocking -XX:+UseLargePages -XX:TLABAllocationWeight=55 -XX:ThreadStackSize=512 -XX:SurvivorRatio=31 -XX:TargetSurvivorRatio=95 -XX:InlineSmallCode=10k -XX:MaxGCPauseMillis=300 -XX:LoopUnrollLimit=100 -XX:+UseTransparentHugePages

Tuning None
Notes None
JVM Instance jvm_TxInjector_1
Parts of Benchmark TxInjector
JVM Instance Description jvm_1
Command Line

-Xms2g -Xmx2g -Xmn1536m -XX:+UseParallelGC -XX:CICompilerCount=2 -XX:ParallelGCThreads=2

Tuning None
Notes None
max-jOPS = jOPS passed before the First Failure
Pass/Fail Pass Pass Fail Fail Fail
jOPS 110121 111448 112775 114101 115428
critical-jOPS = Geomean ( jOPS @ 10000; 25000; 50000; 75000; 100000; SLAs )
Response time percentile is 99-th
SLA (us) 10000 25000 50000 75000 100000 Geomean
jOPS 30894 45441 51080 52628 58819 46694
  Percentile
  10-th 50-th 90-th 95-th 99-th 100-th
500us 2654 / 3980 - / 1327 - / 1327 - / 1327 - / 1327 - / 1327
1000us 9287 / 10614 3980 / 5307 1327 / 2654 1327 / 2654 - / 1327 - / 1327
5000us 84913 / 86239 30515 / 31842 22555 / 23882 19901 / 21228 15921 / 17248 6634 / 2654
10000us 91546 / 92873 76952 / 78279 43783 / 45110 39803 / 41130 33169 / 25208 11941 / 2654
25000us 94200 / 95527 87566 / 88893 74299 / 75625 68992 / 70318 46437 / 42456 15921 / 2654
50000us 96853 / 98180 91546 / 92873 82259 / 83586 76952 / 78279 54397 / 47763 15921 / 2654
75000us 98180 / 99507 92873 / 94200 86239 / 87566 80932 / 82259 54397 / 51744 15921 / 2654
100000us 99507 / 100834 94200 / 95527 87566 / 88893 83586 / 84913 59704 / 57051 15921 / 2654
200000us 108794 / 104814 96853 / 98180 92873 / 94200 91546 / 92873 79606 / 80932 15921 / 2654
500000us 111448 / - 108794 / 110121 102161 / 103487 100834 / 102161 98180 / 99507 86239 / 76952
1000000us 111448 / - 111448 / - 111448 / - 111448 / - 110121 / 111448 100834 / 102161
Probes jOPS / Total jOPS
Request Mix Accuracy
Note
(Actual % in the Mix - Expected % in the Mix) must be within:
'Main Tx' limit of +/-5.0% for the requests whose expected % in the mix is >= 10.0%
'Minor Tx' limit of +/-1.0% for the requests whose expected % in the mix is < 10.0%
There were no non-critical failures in Response Time curve building
Delay between status pings
IR/PR Accuracy
This section lists properties only set by user
Property Name Default Controller Group1.Backend.beJVM Group1.TxInjector.txiJVM1 Group2.Backend.beJVM Group2.TxInjector.txiJVM1 Group3.Backend.beJVM Group3.TxInjector.txiJVM1 Group4.Backend.beJVM Group4.TxInjector.txiJVM1 Group5.Backend.beJVM Group5.TxInjector.txiJVM1 Group6.Backend.beJVM Group6.TxInjector.txiJVM1 Group7.Backend.beJVM Group7.TxInjector.txiJVM1 Group8.Backend.beJVM Group8.TxInjector.txiJVM1
specjbb.comm.connect.client.pool.size 256 80 256 256 256 256 256 256 256 256
specjbb.comm.connect.selector.runner.count 0 3
specjbb.comm.connect.timeouts.connect 60000 600000
specjbb.comm.connect.timeouts.read 60000 600000
specjbb.comm.connect.timeouts.write 60000 600000
specjbb.comm.connect.worker.pool.max 256 256 90 90 90 90 90 90 90 90 90 90 90 90 90 90 90 90
specjbb.comm.connect.worker.pool.min 1 1 8 8 8 8 8 8 8 8
specjbb.customerDriver.threads 64 {probe=64, saturate=74}
specjbb.forkjoin.workers 48 {Tier1=80, Tier2=26, Tier3=10}
specjbb.group.count 1 8
specjbb.mapreducer.pool.size 48 28
specjbb.txi.pergroup.count 1 1
View table in csv format
 
Level: COMPLIANCE
Check Agent Result
Check properties on compliance All PASSED
 
Level: CORRECTNESS
Check Agent Result
Compare SM and HQ Inventory All PASSED
High-bound (max attempted) is 132676 IR
High-bound (settled) is 120968 IR