Copyright © 2015-2017 Standard Performance Evaluation Corporation
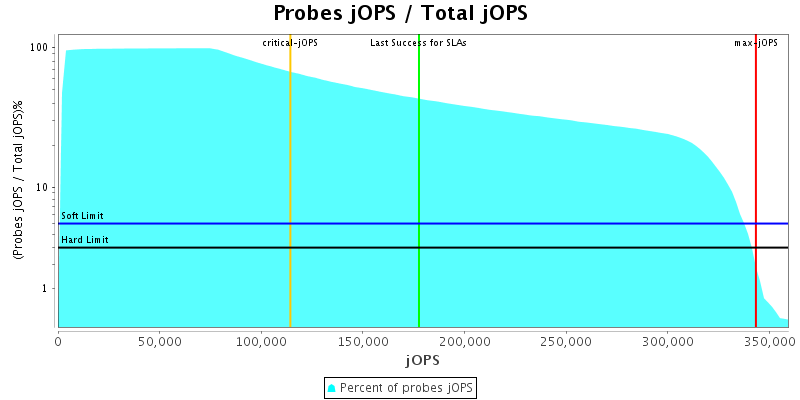
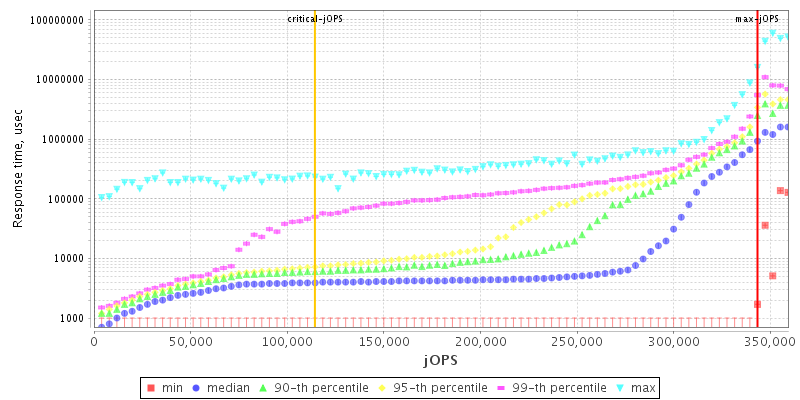
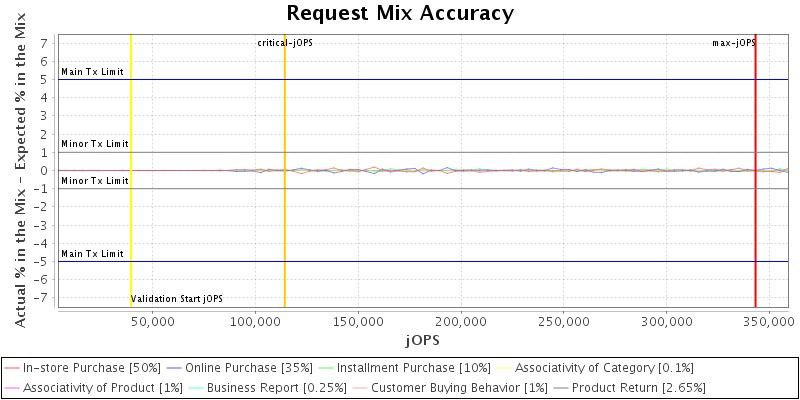
| Cisco Systems Cisco UCS C480 M5 | 343284 SPECjbb2015-MultiJVM max-jOPS 114296 SPECjbb2015-MultiJVM critical-jOPS |
||
| Tested by: Cisco Systems | Test Sponsor: Cisco Systems | Test location: San Jose, CA | Test date: June 21, 2017 |
| SPEC license #: 9019 | Hardware Availability: August-2016 | Software Availability: April-2017 | Publication: Tue Jul 11 13:21:27 EDT 2017 |
|
SPECjbb2015-MultiJVM: Multiple JVMs/Single Host
(# of groups: 8) |
 |
|
|
|
||||||||||||||||||||||||||||||||||||||||||||||||||||||||||||
|
|
|||||||||||||||||||||||||||||||||||||||||||||||||||||||||||||||||||||||||||||||||||||||||||||||||||||||||||||||||||||||||||||||||||||||||
 |
|
| This section lists properties only set by user | |||||||||||||||||||||||||||||||||
| |||||||||||||||||||||||||||||||||
| View table in csv format |
| Level: COMPLIANCE | ||
| Check | Agent | Result |
| Check properties on compliance | All | PASSED |
| Level: CORRECTNESS | ||
| Check | Agent | Result |
| Compare SM and HQ Inventory | All | PASSED |