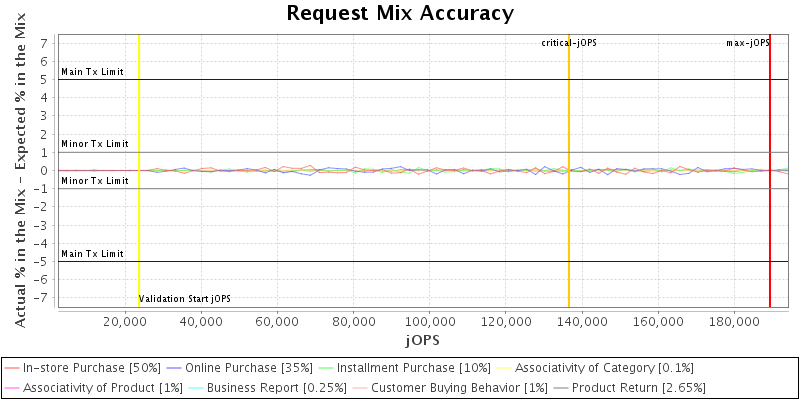
Hewlett Packard Enterprise Synergy 680 Gen9 189334 SPECjbb2015-Distributed max-jOPS
136537 SPECjbb2015-Distributed critical-jOPS
Tested by: Hewlett Packard Enterprise Test Sponsor: Hewlett Packard Enterprise Test location: Houston, TX Test date: August 03, 2016
SPEC license #: 3 Hardware Availability: Jan-2017 Software Availability: Jul-2016 Publication: Nov 09, 2016
Benchmark Results Summary
 
Overall Throughput RT curve
Overall SUT (System Under Test) Description
VendorHewlett Packard Enterprise
Vendor URLhttp://hpe.com/
System SourceSingle Supplier
System DesignationCompute Module
Total Systems1
All SUT Systems IdenticalYes
Total Nodes1
All Nodes IdenticalYes
Nodes Per System1
Total Chips4
Total Cores96
Total Threads192
Total Memory Amount (GB)2048
Total OS Images1
SW EnvironmentNon-virtual
 
Hardware hw_1
NameSynergy 680 Gen9
VendorHewlett Packard Enterprise
Vendor URLhttp://hpe.com/
AvailableJan-2017
ModelSynergy 680 Gen9
Form FactorFull-height double-wide Compute Module
CPU NameIntel Xeon E7-8890 v4
CPU Characteristics24 Core, 2.20 GHz, 60 MB L3 Cache (Turbo Boost Technology up to 3.4 GHz)
Number of Systems1
Nodes Per System1
Chips Per System4
Cores Per System96
Cores Per Chip24
Threads Per System192
Threads Per Core2
VersionI40 07/20/2016
CPU Frequency (MHz)2200
Primary Cache32 KB I + 32 KB D on chip per core
Secondary Cache256 KB I+D on chip per core
Tertiary Cache60 MB I+D on chip per chip
Other CacheNone
Disk1 x 400 GB SSD SAS
File SystemXFS
Memory Amount (GB)2048
# and size of DIMM(s)64 x 32 GB
Memory Details32 GB 2Rx4 PC4-2400T-R, running at 1600MHz
# and type of Network Interface Cards (NICs)Synergy 3820C 10/20Gb CNA
Power Supply Quantity and Rating (W)6 x 2650
Other HardwareNone
Cabinet/Housing/EnclosureSynergy 12000 Frame
Shared DescriptionNone
Shared CommentNone
NotesNone
Other Hardware network_1
NameNone
VendorNone
Vendor URLNone
VersionNone
AvailableNone
BitnessNone
NotesNone
Operating System os_1
NameRed Hat Enterprise Linux Server 7.2
VendorRedHat
Vendor URLhttp://redhat.com/
Version3.10.0-327
AvailableNov-2015
Bitness64
NotesNone
Java Virtual Machine jvm_1
NameOracle Java SE 8u102
VendorOracle
Vendor URLhttp://oracle.com/
VersionJava HotSpot 64-bit Server VM, version 1.8.0_102
AvailableJul-2016
Bitness64
NotesNone
Other Software other_1
NameNone
VendorNone
Vendor URLNone
VersionNone
AvailableNone
BitnessNone
NotesNone
Hardware hw_2
NameProLiant DL180 Gen9
VendorHewlett Packard Enterprise
Vendor URLhttp://hpe.com/
AvailableMar-2016
ModelProLiant DL180 Gen9
Form Factor2U Rack
CPU NameIntel Xeon E5-2695 v4
CPU Characteristics18 Core, 2.1 GHz, 45 MB L3 Cache (Turbo Boost Technology up to 3.3 GHz)
Number of Systems1
Nodes Per System1
Chips Per System2
Cores Per System36
Cores Per Chip18
Threads Per System72
Threads Per Core2
VersionU20 06/24/2016
CPU Frequency (MHz)2100
Primary Cache32 KB I + 32 KB D on chip per core
Secondary Cache256 KB I+D on chip per core
Tertiary Cache45 MB I+D on chip per chip
Other CacheNone
Disk1 x 1 TB SATA 7200 RPM
File SystemXFS
Memory Amount (GB)256
# and size of DIMM(s)8 x 32 GB
Memory Details32 GB 2Rx4 PC4-2400T-R
# and type of Network Interface Cards (NICs)HP Ethernet 1 Gb 2-Port
Power Supply Quantity and Rating (W)2 x 900
Other HardwareNone
Cabinet/Housing/EnclosureNone
Shared DescriptionNone
Shared CommentNone
NotesNone
Other Hardware network_2
NameNone
VendorNone
Vendor URLNone
VersionNone
AvailableNone
BitnessNone
NotesNone
Operating System os_2
NameSUSE Linux Enterprise Server 12 SP1
VendorSUSE
Vendor URLhttps://www.suse.com/
Version3.12.49-11-default
AvailableDec-2015
Bitness64
NotesNone
Java Virtual Machine jvm_2
NameOracle Java SE 8u102
VendorOracle
Vendor URLhttp://oracle.com/
VersionJava HotSpot 64-bit Server VM, version 1.8.0_102
AvailableDec-2016
Bitness64
NotesNone
Other Software other_2
NameNone
VendorNone
Vendor URLNone
VersionNone
AvailableNone
BitnessNone
NotesNone
Hardware
OS Images os_Image_1(1)
Hardware Description hw_1
Number of Systems 1
SW Environment non-virtual
Tuning
  • Hyper Threading=Enabled
  • QPI Snoop Configuration=Home Snoop
  • Power Profile=Maximum Performance
  • Thermal Configuration=Maximum Cooling
  • Collaborative Power Control=Disabled
  • Processor Power and Utilization Monitoring=Disabled
  • Memory PreFailure Notification=Disabled
  • Memory Patrol Scrub=Disabled
Notes None
OS Image os_Image_1
JVM Instances jvm_Backend_1(4)
OS Image Description os_1
Tuning
  • tuned-adm profile=throughput-performance
  • echo 16000000 > /proc/sys/kernel/sched_latency_ns
  • echo 3000000 > /proc/sys/kernel/sched_min_granularity_ns
  • echo 1000 > /proc/sys/kernel/sched_migration_cost_ns
  • SELINUX=disabled
Notes None
JVM Instance jvm_Backend_1
Parts of Benchmark Backend
JVM Instance Description jvm_1
Command Line

-XX:-UsePerfData -server -XX:AllocatePrefetchInstr=2 -XX:LargePageSizeInBytes=2m -XX:+AggressiveOpts -XX:-UseAdaptiveSizePolicy -XX:+AlwaysPreTouch -XX:-UseBiasedLocking -XX:MaxMetaspaceSize=256m -XX:MetaspaceSize=256m -XX:+UseLargePages -XX:+UseParallelOldGC -Xms492g -Xmx492g -Xmn470g -XX:SurvivorRatio=48 -XX:TargetSurvivorRatio=90 -XX:ParallelGCThreads=44 -XX:MaxTenuringThreshold=15 -XX:+PrintTenuringDistribution -XX:+PrintGCDetails -XX:+PrintGCTimeStamps

Tuning None
Notes

Used numactl to affinitize each Backend JVM to NUMA node

  • numactl --cpunodebind=0 --localalloc
  • numactl --cpunodebind=1 --localalloc
  • numactl --cpunodebind=2 --localalloc
  • numactl --cpunodebind=3 --localalloc
Hardware
OS Images os_Image_2(1)
Hardware Description hw_2
Number of Systems 1
SW Environment non-virtual
Tuning
  • Hyper Threading=Enabled
  • QPI Snoop Configuration=Cluster on Die
  • Power Profile=Maximum Performance
  • Thermal Configuration=Maximum Cooling
  • Collaborative Power Control=Disabled
  • Processor Power and Utilization Monitoring=Disabled
  • Memory Refresh Rate=1x Refresh
Notes None
OS Image os_Image_2
JVM Instances jvm_Ctr_1(1), jvm_TxInjector_1(4)
OS Image Description os_2
Tuning
  • tuned-adm profile=throughput-performance
Notes None
JVM Instance jvm_Ctr_1
Parts of Benchmark Controller
JVM Instance Description jvm_2
Command Line -Xms2g -Xmx2g -Xmn1536m -XX:+UseCondCardMark -XX:ParallelGCThreads=18 -XX:-UsePerfData -XX:+UseParallelOldGC
Tuning None
Notes None
JVM Instance jvm_TxInjector_1
Parts of Benchmark TxInjector
JVM Instance Description jvm_2
Command Line -Xms2g -Xmx2g -Xmn1536m -XX:+UseCondCardMark -XX:ParallelGCThreads=18 -XX:-UsePerfData -XX:+UseParallelOldGC
Tuning None
Notes None
max-jOPS = jOPS passed before the First Failure
Pass/Fail Pass Pass Pass Fail Fail
jOPS 184601 186968 189334 191701 194068
critical-jOPS = Geomean ( jOPS @ 10000; 25000; 50000; 75000; 100000; SLAs )
Response time percentile is 99-th
SLA (us) 10000 25000 50000 75000 100000 Geomean
jOPS 86778 149890 152059 152059 157778 136537
  Percentile
  10-th 50-th 90-th 95-th 99-th 100-th
500us - / 2367 - / 2367 - / 2367 - / 2367 - / 2367 - / 2367
1000us - / 2367 - / 2367 - / 2367 - / 2367 - / 2367 - / 2367
5000us 184601 / 186968 130167 / 132534 49700 / 52067 40234 / 42600 23667 / 26033 - / 2367
10000us 184601 / 186968 175134 / 177501 125434 / 127801 113601 / 115967 89934 / 85200 16567 / 2367
25000us 184601 / 186968 182234 / 184601 172768 / 175134 168034 / 170401 151468 / 146734 61534 / 11833
50000us 184601 / 186968 184601 / 186968 175134 / 177501 172768 / 175134 153834 / 146734 89934 / 14200
75000us 184601 / 186968 184601 / 186968 175134 / 177501 172768 / 175134 153834 / 146734 89934 / 14200
100000us 184601 / 186968 184601 / 186968 179868 / 177501 172768 / 175134 160934 / 156201 89934 / 14200
200000us 186968 / 189334 184601 / 186968 179868 / 182234 177501 / 179868 168034 / 170401 89934 / 26033
500000us 189334 / - 184601 / 186968 184601 / 186968 184601 / 186968 184601 / 182234 170401 / 163301
1000000us 189334 / - 189334 / - 186968 / 189334 184601 / 186968 184601 / 186968 184601 / 182234
Probes jOPS / Total jOPS
Request Mix Accuracy
Note
(Actual % in the Mix - Expected % in the Mix) must be within:
'Main Tx' limit of +/-5.0% for the requests whose expected % in the mix is >= 10.0%
'Minor Tx' limit of +/-1.0% for the requests whose expected % in the mix is < 10.0%
There were no non-critical failures in Response Time curve building
Delay between status pings
IR/PR Accuracy
This section lists properties only set by user
Property Name Default Controller
specjbb.comm.connect.selector.runner.count 0 4
specjbb.comm.connect.timeouts.connect 60000 600000
specjbb.comm.connect.timeouts.read 60000 600000
specjbb.comm.connect.timeouts.write 60000 600000
specjbb.comm.connect.worker.pool.max 256 64
specjbb.controller.host localhost 10.10.0.46
specjbb.controller.maxir.maxFailedPoints 3 1
specjbb.forkjoin.workers 72 {Tier1=252, Tier2=68, Tier3=29}
specjbb.group.count 1 4
specjbb.txi.pergroup.count 1 1
View table in csv format
 
Level: COMPLIANCE
Check Agent Result
Check properties on compliance All PASSED
 
Level: CORRECTNESS
Check Agent Result
Compare SM and HQ Inventory All PASSED
High-bound (max attempted) is 236668 IR
High-bound (settled) is 197290 IR