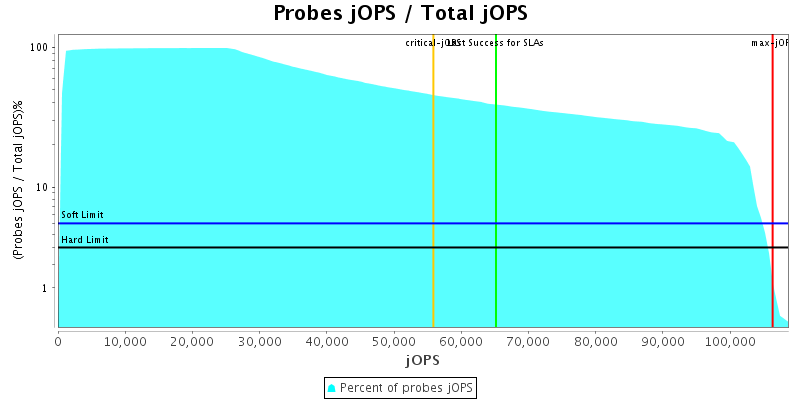
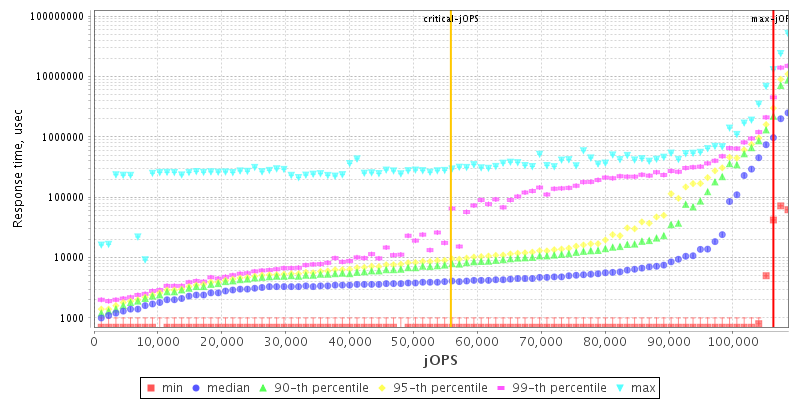
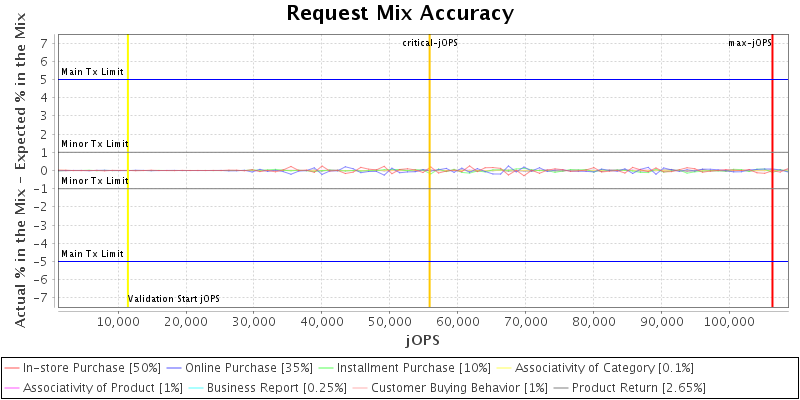
Hewlett Packard Enterprise ProLiant DL360 Gen9 106337 SPECjbb2015-Distributed max-jOPS
55858 SPECjbb2015-Distributed critical-jOPS
Tested by: Hewlett Packard Enterprise Test Sponsor: Hewlett Packard Enterprise Test location: Houston, TX Test date: March 07, 2016
SPEC license #: 3 Hardware Availability: Mar 2016 Software Availability: Mar 2016 Publication: Mar 30, 2016
Benchmark Results Summary
 
Overall Throughput RT curve
Overall SUT (System Under Test) Description
VendorHewlett Packard Enterprise
Vendor URLhttp://hpe.com/
System SourceSingle Supplier
System DesignationServer Rack
Total Systems1
All SUT Systems IdenticalYes
Total Nodes1
All Nodes IdenticalYes
Nodes Per System1
Total Chips2
Total Cores44
Total Threads88
Total Memory Amount (GB)512 GB
Total OS Images1
SW EnvironmentNon-virtual
 
Hardware hw_1
NameProLiant DL360 Gen9
VendorHewlett Packard Enterprise
Vendor URLhttp://hpe.com/
AvailableMar 2016
ModelProLiant DL360 Gen9
Form Factor1U Rack
CPU NameIntel Xeon E5-2699 v4
CPU Characteristics22 Core, 2.2 GHz, 55 MB L3 Cache (Turbo Boost Technology up to 3.6 GHz)
Number of Systems1
Nodes Per System1
Chips Per System2
Cores Per System44
Cores Per Chip22
Threads Per System88
Threads Per Core2
VersionP89 02/22/2016
CPU Frequency (MHz)2200
Primary Cache32 KB I + 32 KB D on chip per core
Secondary Cache256 KB I+D on chip per core
Tertiary Cache55 MB I+D on chip per chip
Other CacheNone
Disk2 x 400 GB
File SystemXFS
Memory Amount (GB)512
# and size of DIMM(s)16 x 32768 MB
Memory Details32 GB 2Rx4 PC4-2400T-R
# and type of Network Interface Cards (NICs)HPE Ethernet 1 Gb 4-Port
Power Supply Quantity and Rating (W)2 x 800
Other HardwareNone
Cabinet/Housing/EnclosureNone
Shared DescriptionNone
Shared CommentNone
NotesNone
Other Hardware network_1
NameNone
VendorNone
Vendor URLNone
VersionNone
AvailableNone
BitnessNone
NotesNone
Operating System os_1
NameRed Hat Enterprise Linux Server 7.2
VendorRedHat
Vendor URLhttp://redhat.com/
Version3.10.0-327
AvailableNov 2015
Bitness64
NotesNone
Java Virtual Machine jvm_1
NameOracle Java SE 8u72
VendorOracle
Vendor URLhttp://oracle.com/
VersionJava HotSpot 64-bit Server VM, version 1.8.0_72
AvailableJan 2016
Bitness64
NotesNone
Other Software other_1
NameNone
VendorNone
Vendor URLNone
VersionNone
AvailableNone
BitnessNone
NotesNone
Hardware hw_2
NameProLiant DL60 Gen9
VendorHewlett Packard Enterprise
Vendor URLhttp://hpe.com/
AvailableMar 2016
ModelProLiant DL60 Gen9
Form Factor1U Rack
CPU NameIntel Xeon CPU E5-2660 v4
CPU Characteristics14 Core, 2.0 GHz, 35 MB L3 Cache (Turbo Boost Technology up to 3.2 GHz)
Number of Systems1
Nodes Per System1
Chips Per System2
Cores Per System28
Cores Per Chip14
Threads Per System56
Threads Per Core2
VersionU15 02/22/2016
CPU Frequency (MHz)2000
Primary Cache32 KB I +32 KB D on chip per core
Secondary Cache256 KB I+D on chip per core
Tertiary Cache35 MB I+D on chip per chip
Other CacheNone
Disk1 x 750 GB
File SystemXFS
Memory Amount (GB)256
# and size of DIMM(s)8 x 32768 MB
Memory Details32 GB 2Rx4 PC4-2400T-R
# and type of Network Interface Cards (NICs)HPE Ethernet 1 Gb 2-Port
Power Supply Quantity and Rating (W)2 x 900
Other HardwareNone
Cabinet/Housing/EnclosureNone
Shared DescriptionNone
Shared CommentNone
NotesNone
Other Hardware network_2
NameNone
VendorNone
Vendor URLNone
VersionNone
AvailableNone
BitnessNone
NotesNone
Operating System os_2
NameRed Hat Enterprise Linux Server 7.2
VendorRedHat
Vendor URLhttp://redhat.com/
Version3.10.0-327
AvailableNov 2015
Bitness64
NotesNone
Java Virtual Machine jvm_2
NameOracle Java SE 8u72
VendorOracle
Vendor URLhttp://oracle.com/
VersionJava HotSpot 64-bit Server VM, version 1.8.0_72
AvailableJan 2016
Bitness64
NotesNone
Other Software other_2
NameNone
VendorNone
Vendor URLNone
VersionNone
AvailableNone
BitnessNone
NotesNone
Hardware
OS Images os_Image_1(1)
Hardware Description hw_1
Number of Systems 1
SW Environment non-virtual
Tuning
  • Hyper Threading=Enabled
  • QPI Snoop Configuration=Cluster on Die
  • Power Profile=Maximum Performance
  • Thermal Configuration=Maximum Cooling
  • Collaborative Power Control=Disabled
  • Processor Power and Utilization Monitoring=Disabled
  • Memory Refresh Rate=1x Refresh
Notes None
OS Image os_Image_1
JVM Instances jvm_Backend_1(4)
OS Image Description os_1
Tuning
  • SELINUX=disabled
  • tuned-adm profile=throughput-performance
  • echo 16000000 > /proc/sys/kernel/sched_latency_ns
  • echo 6000000 > /proc/sys/kernel/sched_min_granularity_ns
Notes None
JVM Instance jvm_Backend_1
Parts of Benchmark Backend
JVM Instance Description jvm_1
Command Line None
Tuning -Xms120g -Xmx120g -XX:-UsePerfData -XX:-UseAdaptiveSizePolicy -XX:-UseBiasedLocking -XX:+UseParallelOldGC -XX:SurvivorRatio=28 -XX:TargetSurvivorRatio=95 -XX:ParallelGCThreads=36 -XX:MaxTenuringThreshold=15 -server -Xmn116g -XX:LargePageSizeInBytes=2m -XX:+UseLargePages -XX:+AlwaysPreTouch -XX:+AggressiveOpts -XX:+DisableExplicitGC
Notes

Used numactl to affinitize each Backend JVM to NUMA node.

  • numactl --cpunodebind=0 --localalloc
  • numactl --cpunodebind=1 --localalloc
  • numactl --cpunodebind=2 --localalloc
  • numactl --cpunodebind=3 --localalloc
Hardware
OS Images os_Image_2(1)
Hardware Description hw_2
Number of Systems 1
SW Environment non-virtual
Tuning
  • Hyper Threading=Enabled
  • QPI Snoop Configuration=Cluster on Die
  • Power Profile=Maximum Performance
  • Thermal Configuration=Maximum Cooling
  • Collaborative Power Control=Disabled
  • Processor Power and Utilization Monitoring=Disabled
  • Memory Refresh Rate=1x Refresh
Notes None
OS Image os_Image_2
JVM Instances jvm_Ctr_1(1), jvm_TxInjector_1(4)
OS Image Description os_2
Tuning
  • SELINUX=disabled
  • tuned-adm profile=network-latency
  • echo 16000000 > /proc/sys/kernel/sched_latency_ns
  • echo 6000000 > /proc/sys/kernel/sched_min_granularity_ns
Notes None
JVM Instance jvm_Ctr_1
Parts of Benchmark Controller
JVM Instance Description jvm_2
Command Line None
Tuning -Xms2g -Xmx2g -Xmn1536m -XX:+UseCondCardMark -XX:ParallelGCThreads=18 -XX:-UsePerfData -XX:+UseParallelOldGC
Notes None
JVM Instance jvm_TxInjector_1
Parts of Benchmark TxInjector
JVM Instance Description jvm_2
Command Line None
Tuning -Xms2g -Xmx2g -Xmn1536m -XX:+UseCondCardMark -XX:ParallelGCThreads=18 -XX:-UsePerfData -XX:+UseParallelOldGC
Notes None
max-jOPS = jOPS passed before the First Failure
Pass/Fail Pass Pass Pass Fail Fail
jOPS 104050 105194 106337 107481 108624
critical-jOPS = Geomean ( jOPS @ 10000; 25000; 50000; 75000; 100000; SLAs )
Response time percentile is 99-th
SLA (us) 10000 25000 50000 75000 100000 Geomean
jOPS 42878 55455 56598 61458 65746 55858
  Percentile
  10-th 50-th 90-th 95-th 99-th 100-th
500us - / 1143 - / 1143 - / 1143 - / 1143 - / 1143 - / 1143
1000us 3430 / 4574 1143 / 2287 - / 1143 - / 1143 - / 1143 - / 1143
5000us 98333 / 99477 74322 / 75465 32015 / 33159 25155 / 26298 20581 / 21725 - / 1143
10000us 99477 / 100620 91473 / 92616 67461 / 68605 58314 / 59457 44593 / 41163 8004 / 1143
25000us 100620 / 101763 98333 / 99477 89186 / 90329 82326 / 83469 57170 / 53740 8004 / 3430
50000us 101763 / 102907 98333 / 99477 91473 / 92616 89186 / 90329 57170 / 56027 8004 / 3430
75000us 102907 / 104050 98333 / 99477 93760 / 92616 89186 / 90329 64031 / 60601 8004 / 3430
100000us 102907 / 104050 99477 / 100620 94903 / 96046 91473 / 90329 65174 / 66318 8004 / 3430
200000us 104050 / 105194 100620 / 101763 97190 / 98333 94903 / 96046 78895 / 80039 8004 / 3430
500000us 105194 / 106337 104050 / 105194 100620 / 101763 100620 / 101763 98333 / 99477 91473 / 69748
1000000us 106337 / - 106337 / - 104050 / 105194 104050 / 105194 102907 / 104050 98333 / 99477
Probes jOPS / Total jOPS
Request Mix Accuracy
Note
(Actual % in the Mix - Expected % in the Mix) must be within:
'Main Tx' limit of +/-5.0% for the requests whose expected % in the mix is >= 10.0%
'Minor Tx' limit of +/-1.0% for the requests whose expected % in the mix is < 10.0%
There were no non-critical failures in Response Time curve building
Delay between status pings
IR/PR Accuracy
This section lists properties only set by user
Property Name Default Controller
specjbb.comm.connect.selector.runner.count 0 4
specjbb.comm.connect.timeouts.connect 60000 600000
specjbb.comm.connect.timeouts.read 60000 600000
specjbb.comm.connect.timeouts.write 60000 600000
specjbb.controller.host localhost 10.10.0.57
specjbb.controller.maxir.maxFailedPoints 3 1
specjbb.forkjoin.workers 56 {Tier1=125, Tier2=62, Tier3=22}
specjbb.group.count 1 4
specjbb.txi.pergroup.count 1 1
View table in csv format
 
Level: COMPLIANCE
Check Agent Result
Check properties on compliance All PASSED
 
Level: CORRECTNESS
Check Agent Result
Compare SM and HQ Inventory All PASSED
High-bound (max attempted) is 114341 IR
High-bound (settled) is 108130 IR