Fujitsu SPARC M10-4S 450467 SPECjbb2015-MultiJVM max-jOPS
278958 SPECjbb2015-MultiJVM critical-jOPS
Tested by: Fujitsu Test Sponsor: Fujitsu Test location: Numazu, Japan Test date: Jan 14, 2016
SPEC license #: 19 Hardware Availability: Apr-2014 Software Availability: Nov-2015 Publication: Feb 19, 2016
Benchmark Results Summary
 
Overall Throughput RT curve
Overall SUT (System Under Test) Description
VendorFujitsu
Vendor URLhttp://www.fujitsu.com/
System SourceSingle Supplier
System DesignationServer Rack
Total Systems1
All SUT Systems IdenticalYES
Total Nodes1
All Nodes IdenticalYES
Nodes Per System1
Total Chips20
Total Cores320
Total Threads640
Total Memory Amount (GB)12288
Total OS Images1
SW EnvironmentNon-virtual
 
Hardware hw_1
NameSPARC M10-4S
VendorFujitsu
Vendor URLhttp://www.fujitsu.com/
AvailableApr-2014
ModelSPARC M10-4S
Form Factor5 x 4RU rackmount server and 1 x 4RU rackmount crossbar box
CPU NameSPARC64 X+
CPU Characteristics16 Core, 3.7GHz, 24MB L2 Cache
Number of Systems1
Nodes Per System1
Chips Per System20
Cores Per System320
Cores Per Chip16
Threads Per System640
Threads Per Core2
VersionNone
CPU Frequency (MHz)3700
Primary Cache64 KB I + 64 KB D on chip per core
Secondary Cache24 MB I+D on chip per chip
Tertiary CacheNone
Other CacheNone
Disk1 x 600 GB SAS, 10025 RPM SAS disk drive
File SystemZFS
Memory Amount (GB)12288
# and size of DIMM(s)256 x 32GB and 64 x 64GB
Memory Details32GB 4Rx4 PC3-10600R-9 ECC; slots populated on BB#0,1,2,3
64GB 8Rx4 PC3-10600LR-9 ECC; slots populated on BB#4
# and type of Network Interface Cards (NICs)4 x 10/100/1000 NICs (on board)
Power Supply Quantity and Rating (W)12 x 2500
Other HardwareNone
Cabinet/Housing/EnclosureNone
Shared DescriptionNone
Shared CommentNone
NotesNone
Other Hardware network_1
NameNone
VendorNone
Vendor URLNone
VersionNone
AvailableNone
BitnessNone
NotesNone
Operating System os_1
NameOracle Solaris 11.3
VendorOracle Corporation
Vendor URLhttp://www.oracle.com/
VersionOracle Solaris 11.3.2.4.0
AvailableNov-2015
Bitness64
NotesNone
Java Virtual Machine jvm_1
NameOracle Java SE 8u66
VendorOracle Corporation
Vendor URLhttp://www.oracle.com/
VersionJava HotSpot(TM) 64-Bit Server VM, version 1.8.0_66
AvailableOct-2015
Bitness64
Notesnote
Other Software other_1
NameNone
VendorNone
Vendor URLNone
VersionNone
AvailableNone
BitnessNone
NotesNone
Hardware
OS Images os_Image_1(1)
Hardware Description hw_1
Number of Systems 1
SW Environment non-virtual
Tuning tuning
Notes notes
OS Image os_Image_1
JVM Instances jvm_Ctr_1(1), jvm_Backend_1(20), jvm_TxInjector_1(20)
OS Image Description os_1
Tuning /etc/system parameters
autoup = 1555200
Causes pages older than the listed number of seconds to be written by fsflush.
tune_t_fsflushr = 259200
Controls how many seconds elapse between runs of the page flush daemon, fsflush.
lpg_alloc_prefer=1
Indicates that extra effort should be taken to ensure that pages are created in the nearby lgroup (NUMA location).
Notes All java processes were run using the FX scheduling class.
The "Logical Domains Manager" service was turned off using svcadm disable ldmd.
JVM Instance jvm_Ctr_1
Parts of Benchmark Controller
JVM Instance Description jvm_1
Command Line -Xmx2000m -Xms2000m -Xmn1200m -XX:LargePageSizeInBytes=4m -XX:MaxInlineSize=200 -XX:InlineSmallCode=2000 -verbose:gc -XX:ParallelGCThreads=4
Tuning Run in processor set #2
Notes The object-caching memory allocation library libumem was used by setting the environment variable LD_PRELOAD_64=/lib/sparcv9/libumem.so. All java processes were run using the FX scheduling class.
JVM Instance jvm_Backend_1
Parts of Benchmark Backend
JVM Instance Description jvm_1
Command Line -verbose:gc -XX:+PrintGCDetails -XX:+AlwaysPreTouch -XX:LargePageSizeInBytes=256m -XX:AllocatePrefetchLines=8 -XX:InlineSmallCode=2000 -XX:MaxInlineSize=300 -Xms320g -Xmx320g -Xmn300g -XX:+UseParallelOldGC -XX:-UseAdaptiveSizePolicy -XX:ParallelGCThreads=32 -XX:SurvivorRatio=200 -XX:MaxTenuringThreshold=1 -Djava.nio.channels.spi.SelectorProvider=sun.nio.ch.PollSelectorProvider
Tuning Each group (backend and transaction injector) is run in its own processor set consisting of all the virtual processors (threads) belonging to the same physical CPU.
  • $GROUPID < $GROUP_COUNT:
    • psrset -c <all virtual processors of physical CPU#$GROUPID-1>
    • psrset -e $GROUPID $JAVA $JAVA_OPTS_BE -jar specjbb2015.jar -m BACKEND -G=$GROUPID -J=$JVMID
  • $GROUPID = $GROUP_COUNT:
    • $JAVA $JAVA_OPTS_BE -jar specjbb2015.jar -m BACKEND -G=$GROUPID -J=$JVMID
Notes The object-caching memory allocation library libumem was used by setting the environment variable LD_PRELOAD_64=/lib/sparcv9/libumem.so. All java processes were run using the FX scheduling class.
JVM Instance jvm_TxInjector_1
Parts of Benchmark TxInjector
JVM Instance Description jvm_1
Command Line -Xmx2400m -Xms2400m -Xmn1600m -verbose:gc -XX:+PrintGCDetails -XX:ParallelGCThreads=2 -XX:+UseConcMarkSweepGC -XX:ConcGCThreads=1 -XX:SurvivorRatio=8 -XX:TargetSurvivorRatio=90 -XX:MaxTenuringThreshold=8
Tuning Each group (backend and transaction injector) is run in its own processor set consisting of all the virtual processors (threads) belonging to the same physical CPU.
  • $GROUPID < $GROUP_COUNT:
    • psrset -c <all virtual processors of physical CPU#$GROUPID-1>
    • psrset -e $GROUPID $JAVA $JAVA_OPTS_BE -jar specjbb2015.jar -m BACKEND -G=$GROUPID -J=$JVMID
  • $GROUPID = $GROUP_COUNT:
    • $JAVA $JAVA_OPTS_BE -jar specjbb2015.jar -m BACKEND -G=$GROUPID -J=$JVMID
Notes The object-caching memory allocation library libumem was used by setting the environment variable LD_PRELOAD_64=/lib/sparcv9/libumem.so. All java processes were run using the FX scheduling class.
max-jOPS = jOPS passed before the First Failure
Pass/Fail Pass Pass Fail Fail Fail
jOPS 445571 450467 455363 460260 465156
critical-jOPS = Geomean ( jOPS @ 10000; 25000; 50000; 75000; 100000; SLAs )
Response time percentile is 99-th
SLA (us) 10000 25000 50000 75000 100000 Geomean
jOPS 178718 282358 315816 320713 330505 278958
  Percentile
  10-th 50-th 90-th 95-th 99-th 100-th
500us - / 4896 - / 4896 - / 4896 - / 4896 - / 4896 - / 4896
1000us 14689 / 19586 4896 / 9793 - / 4896 - / 4896 - / 4896 - / 4896
5000us 377021 / 381918 220337 / 225233 93031 / 97928 88135 / 93031 68549 / 73446 - / 4896
10000us 391710 / 396607 362332 / 367228 298679 / 303576 269301 / 259508 181166 / 176270 - / 4896
25000us 401503 / 406400 381918 / 386814 347643 / 352539 332954 / 337850 288886 / 279094 - / 4896
50000us 406400 / 411296 386814 / 391710 362332 / 367228 352539 / 357436 313368 / 318265 63653 / 4896
75000us 406400 / 411296 391710 / 396607 367228 / 372125 362332 / 367228 318265 / 323161 146891 / 4896
100000us 411296 / 416192 396607 / 401503 372125 / 377021 362332 / 367228 328057 / 332954 146891 / 4896
200000us 421089 / 425985 406400 / 411296 386814 / 391710 377021 / 381918 362332 / 367228 225233 / 44067
500000us 450467 / - 425985 / 430881 406400 / 411296 396607 / 401503 386814 / 391710 337850 / 342747
1000000us 450467 / - 450467 / - 430881 / 435778 421089 / 425985 406400 / 411296 386814 / 391710
Probes jOPS / Total jOPS
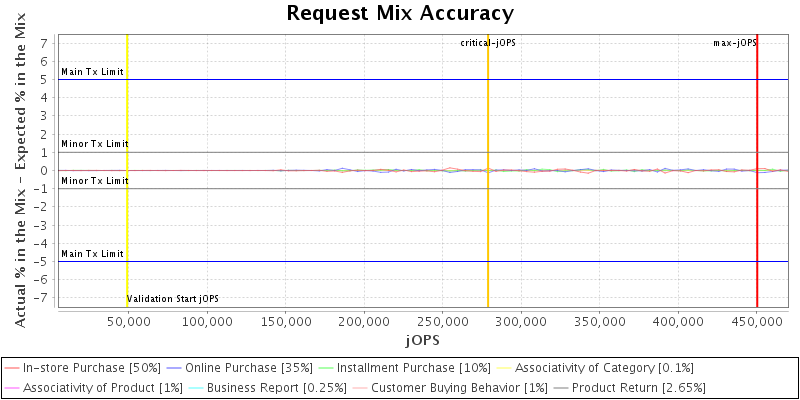
Request Mix Accuracy
Note
(Actual % in the Mix - Expected % in the Mix) must be within:
'Main Tx' limit of +/-5.0% for the requests whose expected % in the mix is >= 10.0%
'Minor Tx' limit of +/-1.0% for the requests whose expected % in the mix is < 10.0%
There were no non-critical failures in Response Time curve building
Delay between status pings
IR/PR Accuracy
This section lists properties only set by user
Property Name Default Controller
specjbb.comm.connect.client.pool.size 256 224
specjbb.customerDriver.threads 64 {=64, probe=64, saturate=80}
specjbb.forkjoin.workers 32 {Tier1=32, Tier2=10, Tier3=20}
specjbb.group.count 1 20
specjbb.txi.pergroup.count 1 1
View table in csv format
 
Level: COMPLIANCE
Check Agent Result
Check properties on compliance All PASSED
 
Level: CORRECTNESS
Check Agent Result
Compare SM and HQ Inventory All PASSED
High-bound (max attempted) is 489638 IR
High-bound (settled) is 474303 IR