
SPECpower_ssj2008
Aggregate Performance Report
Copyright © 2007-2024 Standard Performance Evaluation Corporation
| Lenovo Global Technology ThinkSystem SD530 V3 | ssj_ops@100% = 34,229,913 ssj_ops@100% per Host = 8,557,478 ssj_ops@100% per JVM = 133,711 |
||||
| Test Sponsor: | Lenovo Global Technology | SPEC License #: | 9017 | Test Method: | Multi Node |
| Tested By: | Lenovo Global Technology | Test Location: | Beijing, China | Test Date: | Jan 16, 2024 |
| Hardware Availability: | Mar-2024 | Software Availability: | Jan-2024 | Publication: | Feb 16, 2024 |
| System Source: | Single Supplier | System Designation: | Server | Power Provisioning: | Line-powered |
| Target Load | Actual Load | ssj_ops | |
|---|---|---|---|
| Target | Actual | ||
| Calibration 1 | 34,647,708 | ||
| Calibration 2 | 34,334,934 | ||
| Calibration 3 | 34,277,889 | ||
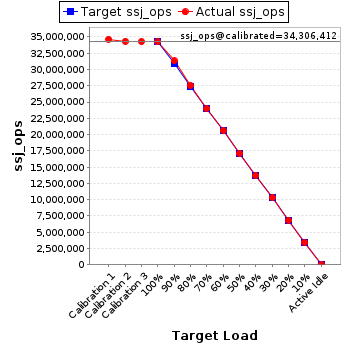
| ssj_ops@calibrated=34,306,412 | |||
| 100% | 99.8% | 34,306,412 | 34,229,913 |
| 90% | 91.4% | 30,875,770 | 31,350,518 |
| 80% | 80.4% | 27,445,129 | 27,575,061 |
| 70% | 70.0% | 24,014,488 | 24,024,804 |
| 60% | 60.0% | 20,583,847 | 20,593,262 |
| 50% | 50.0% | 17,153,206 | 17,139,635 |
| 40% | 40.0% | 13,722,565 | 13,724,575 |
| 30% | 30.0% | 10,291,923 | 10,292,387 |
| 20% | 20.0% | 6,861,282 | 6,858,493 |
| 10% | 10.0% | 3,430,641 | 3,424,140 |
| Active Idle | 0 | 0 | |
| # of Nodes | # of Chips | # of Cores | # of Threads | Total RAM (GB) | # of OS Images | # of JVM Instances |
|---|---|---|---|---|---|---|
| 4 | 4 | 256 | 512 | 1,024 | 4 | 256 |
| Set Identifier: | sut |
| Set Description: | System Under Test |
| # of Identical Nodes: | 4 |
| Comment: | 'SUT' |
| Hardware per Node | |
|---|---|
| Hardware Vendor: | Lenovo Global Technology |
| Model: | ThinkSystem SD530 V3 |
| Form Factor: | 1U |
| CPU Name: | Intel Xeon Platinum 8592+ |
| CPU Characteristics: | 64 Core, 1.9GHz, 320MB L3 Cache |
| CPU Frequency (MHz): | 1900 |
| CPU(s) Enabled: | 64 cores, 1 chip, 64 cores/chip |
| Hardware Threads: | 128 (2 / core) |
| CPU(s) Orderable: | 1 chip |
| Primary Cache: | 32 KB I + 48 KB D on chip per core |
| Secondary Cache: | 128 MB I+D on chip per chip |
| Tertiary Cache: | 320 MB I+D on chip per chip |
| Other Cache: | None |
| Memory Amount (GB): | 256 |
| # and size of DIMM: | 8 x 32768 MB |
| Memory Details: | 32GB 2Rx8 PC5-4800; slots 1 to 8 populated |
| Power Supply Quantity and Rating (W): | None |
| Power Supply Details: | Shared |
| Disk Drive: | 1 x 960GB M.2 SSD |
| Disk Controller: | Integrated NVMe controller |
| # and type of Network Interface Cards (NICs) Installed: | 1 x ThinkSystem 1GbE RJ45 4-port |
| NICs Enabled in Firmware / OS / Connected: | 4/4/1 |
| Network Speed (Mbit): | 1000 |
| Keyboard: | None |
| Mouse: | None |
| Monitor: | None |
| Optical Drives: | No |
| Other Hardware: | None |
| Software per Node | |
|---|---|
| Power Management: | Enabled (see SUT Notes) |
| Operating System (OS): | Microsoft Windows Server 2022 Datacenter |
| OS Version: | Version 21H2 (OS Build 20348.2227) |
| Filesystem: | NTFS |
| JVM Vendor: | Oracle Corporation |
| JVM Version: | Java HotSpot(TM) 64-Bit Server VM (build 17.0.1+12-LTS-39, mixed mode) |
| JVM Command-line Options: | -server -Xmn1900m -Xms2048m -Xmx2048m -XX:ParallelGCThreads=2 -XX:+UseLargePages -XX:LargePageSizeInBytes=2m -XX:InlineSmallCode=1500 -XX:UseAVX=1 -XX:AutoBoxCacheMax=20000 -XX:+UseParallelGC -XX:+OptimizeFill -XX:+AggressiveHeap -XX:MaxInlineSize=270 -XX:FreqInlineSize=2500 |
| JVM Affinity: | start /NODE[0-1] /AFFINITY [0x3, 0xc, 0x30, 0xc0, 0x300, 0xc00, 0x3000, 0xc000, 0x30000, 0xc0000, 0x300000, 0xc00000, 0x3000000, 0xc000000, 0x30000000, 0xc0000000, 0x300000000, 0xc00000000, 0x3000000000, 0xc000000000, 0x30000000000, 0xc0000000000, 0x300000000000, 0xc00000000000, 0x3000000000000, 0xc000000000000, 0x30000000000000, 0xc0000000000000, 0x300000000000000, 0xc00000000000000, 0x3000000000000000, 0xc000000000000000] |
| JVM Instances: | 64 |
| JVM Initial Heap (MB): | 2048 |
| JVM Maximum Heap (MB): | 2048 |
| JVM Address Bits: | 64 |
| Boot Firmware Version: | FNE113F |
| Management Firmware Version: | USX335C |
| Workload Version: | SSJ 1.2.10 |
| Director Location: | Controller |
| Other Software: | KB5034129 |
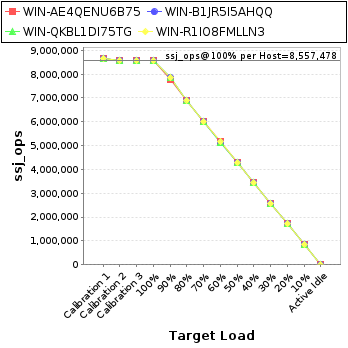
| Host | ssj_ops@100% |
|---|---|
| WIN-AE4QENU6B75 | 8,558,025 |
| WIN-B1JR5I5AHQQ | 8,556,563 |
| WIN-QKBL1DI75TG | 8,559,211 |
| WIN-R1IO8FMLLN3 | 8,556,114 |
| ssj_ops@100% | 34,229,913 |
| ssj_ops@100% per Host | 8,557,478 |
| ssj_ops@100% per JVM | 133,711 |
| Target Load | Actual Load | ssj_ops | |
|---|---|---|---|
| Target | Actual | ||
| Calibration 1 | 8,664,016 | ||
| Calibration 2 | 8,587,587 | ||
| Calibration 3 | 8,571,984 | ||
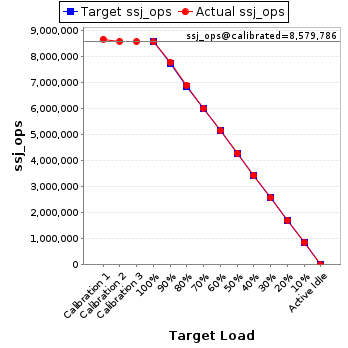
| ssj_ops@calibrated=8,579,786 | |||
| 100% | 99.7% | 8,579,786 | 8,558,025 |
| 90% | 90.7% | 7,721,807 | 7,782,708 |
| 80% | 80.4% | 6,863,828 | 6,897,600 |
| 70% | 70.0% | 6,005,850 | 6,003,618 |
| 60% | 60.0% | 5,147,871 | 5,150,305 |
| 50% | 50.0% | 4,289,893 | 4,288,581 |
| 40% | 40.0% | 3,431,914 | 3,430,775 |
| 30% | 30.0% | 2,573,936 | 2,574,187 |
| 20% | 19.9% | 1,715,957 | 1,711,393 |
| 10% | 10.0% | 857,979 | 856,349 |
| Active Idle | 0 | 0 | |
| Target Load | Actual Load | ssj_ops | |
|---|---|---|---|
| Target | Actual | ||
| Calibration 1 | 8,658,067 | ||
| Calibration 2 | 8,584,344 | ||
| Calibration 3 | 8,568,245 | ||
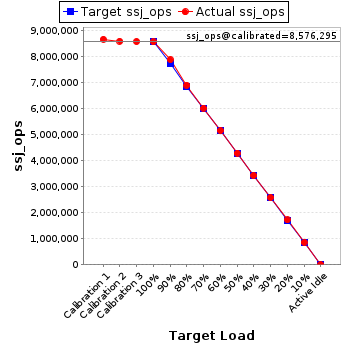
| ssj_ops@calibrated=8,576,295 | |||
| 100% | 99.8% | 8,576,295 | 8,556,563 |
| 90% | 91.8% | 7,718,665 | 7,876,857 |
| 80% | 80.4% | 6,861,036 | 6,893,138 |
| 70% | 70.1% | 6,003,406 | 6,015,966 |
| 60% | 60.0% | 5,145,777 | 5,145,320 |
| 50% | 50.0% | 4,288,147 | 4,284,413 |
| 40% | 40.0% | 3,430,518 | 3,428,490 |
| 30% | 30.0% | 2,572,888 | 2,576,171 |
| 20% | 20.0% | 1,715,259 | 1,716,756 |
| 10% | 10.0% | 857,629 | 858,166 |
| Active Idle | 0 | 0 | |
| Target Load | Actual Load | ssj_ops | |
|---|---|---|---|
| Target | Actual | ||
| Calibration 1 | 8,662,448 | ||
| Calibration 2 | 8,582,924 | ||
| Calibration 3 | 8,568,553 | ||
| ssj_ops@calibrated=8,575,738 | |||
| 100% | 99.8% | 8,575,738 | 8,559,211 |
| 90% | 91.5% | 7,718,164 | 7,846,904 |
| 80% | 80.2% | 6,860,591 | 6,877,019 |
| 70% | 70.0% | 6,003,017 | 6,004,023 |
| 60% | 60.0% | 5,145,443 | 5,145,648 |
| 50% | 50.0% | 4,287,869 | 4,285,879 |
| 40% | 40.0% | 3,430,295 | 3,432,590 |
| 30% | 30.0% | 2,572,721 | 2,572,155 |
| 20% | 20.0% | 1,715,148 | 1,716,220 |
| 10% | 10.0% | 857,574 | 855,737 |
| Active Idle | 0 | 0 | |

| Target Load | Actual Load | ssj_ops | |
|---|---|---|---|
| Target | Actual | ||
| Calibration 1 | 8,663,176 | ||
| Calibration 2 | 8,580,080 | ||
| Calibration 3 | 8,569,107 | ||
| ssj_ops@calibrated=8,574,593 | |||
| 100% | 99.8% | 8,574,593 | 8,556,114 |
| 90% | 91.5% | 7,717,134 | 7,844,048 |
| 80% | 80.6% | 6,859,675 | 6,907,304 |
| 70% | 70.0% | 6,002,215 | 6,001,197 |
| 60% | 60.1% | 5,144,756 | 5,151,989 |
| 50% | 49.9% | 4,287,297 | 4,280,763 |
| 40% | 40.0% | 3,429,837 | 3,432,721 |
| 30% | 30.0% | 2,572,378 | 2,569,874 |
| 20% | 20.0% | 1,714,919 | 1,714,124 |
| 10% | 10.0% | 857,459 | 853,888 |
| Active Idle | 0 | 0 | |
