SPECpower_ssj2008
Host 'WIN-11AFDVMM189' Performance Report
Copyright © 2007-2012 Standard Performance Evaluation Corporation
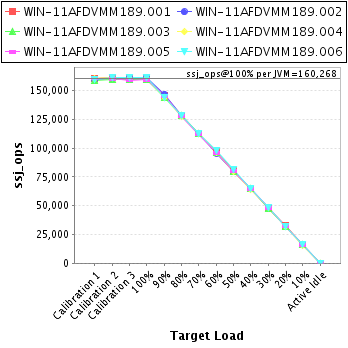
| Acer Incorporated Acer AT350 F2 | ssj_ops@100% = 961,609 ssj_ops@100% per JVM = 160,268 |
||||
| Test Sponsor: | Acer Incorporated | SPEC License #: | 97 | Test Method: | Single Node |
| Tested By: | Acer Incorporated | Test Location: | Taipei, R.O.C. | Test Date: | May 24, 2012 |
| Hardware Availability: | May-2012 | Software Availability: | Dec-2011 | Publication: | Aug 8, 2012 |
| System Source: | Single Supplier | System Designation: | Server | Power Provisioning: | Line-powered |
| Target Load | Actual Load | ssj_ops | |
|---|---|---|---|
| Target | Actual | ||
| Calibration 1 | 958,601 | ||
| Calibration 2 | 963,909 | ||
| Calibration 3 | 962,706 | ||
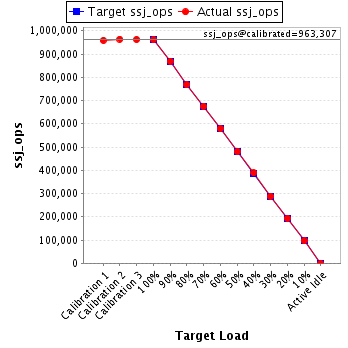
| ssj_ops@calibrated=963,307 | |||
| 100% | 99.8% | 963,307 | 961,609 |
| 90% | 90.3% | 866,977 | 869,465 |
| 80% | 79.7% | 770,646 | 767,984 |
| 70% | 70.1% | 674,315 | 675,326 |
| 60% | 60.1% | 577,984 | 578,707 |
| 50% | 49.9% | 481,654 | 480,834 |
| 40% | 40.3% | 385,323 | 388,395 |
| 30% | 30.0% | 288,992 | 288,991 |
| 20% | 20.1% | 192,661 | 193,316 |
| 10% | 10.0% | 96,331 | 96,548 |
| Active Idle | 0 | 0 | |
| Set Identifier: | sut |
| Set Description: | System Under Test |
| # of Identical Nodes: | 1 |
| Comment: | None |
| Hardware | |
|---|---|
| Hardware Vendor: | Acer Incorporated |
| Model: | Acer AT350 F2 |
| Form Factor: | Tower |
| CPU Name: | Intel Xeon E5-2630 |
| CPU Characteristics: | 6 core, 2.3GHz, 15MB L3 Cache (Turbo Boost Technology up to 2.8GHz) |
| CPU Frequency (MHz): | 2300 |
| CPU(s) Enabled: | 12 cores, 2 chips, 6 cores/chip |
| Hardware Threads: | 24 (2 / core) |
| CPU(s) Orderable: | 1,2 chips |
| Primary Cache: | 32 KB I + 32 KB D on chip per core |
| Secondary Cache: | 256 KB I+D on chip per core |
| Tertiary Cache: | 15 MB I+D on chip per chip |
| Other Cache: | None |
| Memory Amount (GB): | 128 |
| # and size of DIMM: | 16 x 8192 MB |
| Memory Details: | 8GB 2Rx4 PC3L-10600E; Slots 1A,2A,1B,2B,1C,2C,1D,2D and 1E,2E,1F,2F,1G,2G,1H,2H are populated |
| Power Supply Quantity and Rating (W): | 1 x 920 |
| Power Supply Details: | Acer P/N SC.9201S.002 |
| Disk Drive: | 2 x 300GB 15K RPM SAS 3.5" HDD (P/N KH.30007.007) |
| Disk Controller: | LSI MegaRAID SAS 9260-8i |
| # and type of Network Interface Cards (NICs) Installed: | 4 x Intel I350 Gigabit Ethernet controller |
| NICs Enabled in Firmware / OS / Connected: | 4/4/1 |
| Network Speed (Mbit): | 1000 |
| Keyboard: | None |
| Mouse: | None |
| Monitor: | None |
| Optical Drives: | No |
| Other Hardware: | No |
| Software | |
|---|---|
| Power Management: | Power save enabled in OS |
| Operating System (OS): | Windows Server 2008, Enterprise Edition |
| OS Version: | R2 SP1 |
| Filesystem: | NTFS |
| JVM Vendor: | Oracle Corporation |
| JVM Version: | Oracle Java HotSpot(TM) 64-Bit Server VM on Windows, version 1.6.0_26 |
| JVM Command-line Options: | -server -showversion -Xmx2048m -Xms2048m -Xmn1706m -XX:ParallelGCThreads=4 -XX:BiasedLockingStartupDelay=200 -XX:SurvivorRatio=60 -XX:TargetSurvivorRatio=90 -XX:InlineSmallCode=3900 -XX:MaxInlineSize=270 -XX:FreqInlineSize=2500 -XX:AllocatePrefetchDistance=256 -XX:AllocatePrefetchLines=4 -XX:InitialTenuringThreshold=12 -XX:MaxTenuringThreshold=15 -XX:LoopUnrollLimit=45 -XX:+UseCompressedStrings -XX:+AggressiveOpts -XX:+UseLargePages -XX:+UseParallelOldGC -XX:-UseAdaptiveSizePolicy |
| JVM Affinity: | start /affinity [0000000F, 000000F0, 00000F00, 0000F000, 000F0000, 00F00000] |
| JVM Instances: | 6 |
| JVM Initial Heap (MB): | 2048 |
| JVM Maximum Heap (MB): | 2048 |
| JVM Address Bits: | 64 |
| Boot Firmware Version: | D19 |
| Management Firmware Version: | 0.12 |
| Workload Version: | SSJ 1.2.9 |
| Director Location: | Controller |
| Other Software: | None |
| JVM Instance | ssj_ops@100% |
|---|---|
| WIN-11AFDVMM189.001 | 160,181 |
| WIN-11AFDVMM189.002 | 160,972 |
| WIN-11AFDVMM189.003 | 159,407 |
| WIN-11AFDVMM189.004 | 160,706 |
| WIN-11AFDVMM189.005 | 159,401 |
| WIN-11AFDVMM189.006 | 160,942 |
| ssj_ops@100% | 961,609 |
| ssj_ops@100% per JVM | 160,268 |
| Target Load | Actual Load | ssj_ops | |
|---|---|---|---|
| Target | Actual | ||
| Calibration 1 | 160,031 | ||
| Calibration 2 | 160,868 | ||
| Calibration 3 | 160,984 | ||
| ssj_ops@calibrated=160,926 | |||
| 100% | 99.5% | 160,926 | 160,181 |
| 90% | 90.3% | 144,833 | 145,394 |
| 80% | 79.7% | 128,741 | 128,223 |
| 70% | 70.2% | 112,648 | 112,892 |
| 60% | 60.3% | 96,556 | 97,083 |
| 50% | 49.8% | 80,463 | 80,138 |
| 40% | 40.5% | 64,370 | 65,188 |
| 30% | 29.7% | 48,278 | 47,719 |
| 20% | 20.2% | 32,185 | 32,516 |
| 10% | 10.3% | 16,093 | 16,496 |
| Active Idle | 0 | 0 | |
| Target Load | Actual Load | ssj_ops | |
|---|---|---|---|
| Target | Actual | ||
| Calibration 1 | 159,553 | ||
| Calibration 2 | 160,363 | ||
| Calibration 3 | 161,228 | ||
| ssj_ops@calibrated=160,796 | |||
| 100% | 100.1% | 160,796 | 160,972 |
| 90% | 91.3% | 144,716 | 146,780 |
| 80% | 79.8% | 128,637 | 128,322 |
| 70% | 70.0% | 112,557 | 112,625 |
| 60% | 59.5% | 96,477 | 95,609 |
| 50% | 49.5% | 80,398 | 79,623 |
| 40% | 40.3% | 64,318 | 64,765 |
| 30% | 30.1% | 48,239 | 48,473 |
| 20% | 19.8% | 32,159 | 31,821 |
| 10% | 10.0% | 16,080 | 16,081 |
| Active Idle | 0 | 0 | |

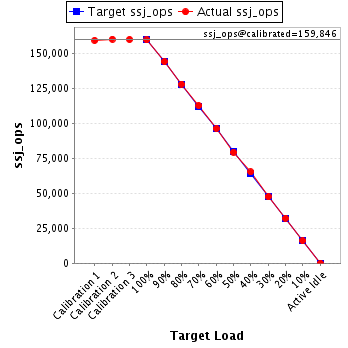
| Target Load | Actual Load | ssj_ops | |
|---|---|---|---|
| Target | Actual | ||
| Calibration 1 | 159,068 | ||
| Calibration 2 | 159,969 | ||
| Calibration 3 | 159,723 | ||
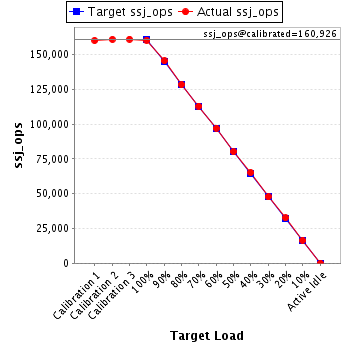
| ssj_ops@calibrated=159,846 | |||
| 100% | 99.7% | 159,846 | 159,407 |
| 90% | 90.0% | 143,861 | 143,910 |
| 80% | 80.0% | 127,877 | 127,947 |
| 70% | 70.5% | 111,892 | 112,653 |
| 60% | 60.2% | 95,908 | 96,218 |
| 50% | 49.7% | 79,923 | 79,377 |
| 40% | 40.8% | 63,938 | 65,176 |
| 30% | 29.7% | 47,954 | 47,456 |
| 20% | 20.2% | 31,969 | 32,260 |
| 10% | 10.0% | 15,985 | 16,061 |
| Active Idle | 0 | 0 | |
| Target Load | Actual Load | ssj_ops | |
|---|---|---|---|
| Target | Actual | ||
| Calibration 1 | 160,135 | ||
| Calibration 2 | 161,038 | ||
| Calibration 3 | 160,307 | ||
| ssj_ops@calibrated=160,673 | |||
| 100% | 100.0% | 160,673 | 160,706 |
| 90% | 89.5% | 144,606 | 143,830 |
| 80% | 79.4% | 128,538 | 127,609 |
| 70% | 69.9% | 112,471 | 112,239 |
| 60% | 60.0% | 96,404 | 96,366 |
| 50% | 49.7% | 80,336 | 79,830 |
| 40% | 39.9% | 64,269 | 64,075 |
| 30% | 30.3% | 48,202 | 48,692 |
| 20% | 20.0% | 32,135 | 32,207 |
| 10% | 9.8% | 16,067 | 15,725 |
| Active Idle | 0 | 0 | |

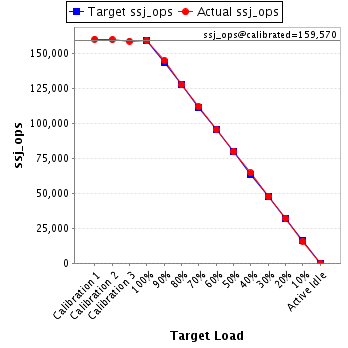
| Target Load | Actual Load | ssj_ops | |
|---|---|---|---|
| Target | Actual | ||
| Calibration 1 | 160,452 | ||
| Calibration 2 | 160,117 | ||
| Calibration 3 | 159,024 | ||
| ssj_ops@calibrated=159,570 | |||
| 100% | 99.9% | 159,570 | 159,401 |
| 90% | 91.0% | 143,613 | 145,256 |
| 80% | 80.0% | 127,656 | 127,708 |
| 70% | 70.3% | 111,699 | 112,200 |
| 60% | 60.0% | 95,742 | 95,765 |
| 50% | 50.2% | 79,785 | 80,086 |
| 40% | 40.5% | 63,828 | 64,656 |
| 30% | 30.1% | 47,871 | 47,989 |
| 20% | 20.2% | 31,914 | 32,166 |
| 10% | 9.9% | 15,957 | 15,875 |
| Active Idle | 0 | 0 | |
| Target Load | Actual Load | ssj_ops | |
|---|---|---|---|
| Target | Actual | ||
| Calibration 1 | 159,362 | ||
| Calibration 2 | 161,553 | ||
| Calibration 3 | 161,440 | ||
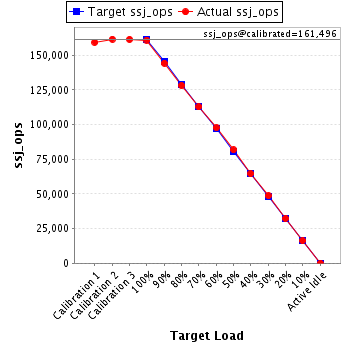
| ssj_ops@calibrated=161,496 | |||
| 100% | 99.7% | 161,496 | 160,942 |
| 90% | 89.3% | 145,347 | 144,295 |
| 80% | 79.4% | 129,197 | 128,176 |
| 70% | 69.8% | 113,047 | 112,716 |
| 60% | 60.5% | 96,898 | 97,666 |
| 50% | 50.6% | 80,748 | 81,780 |
| 40% | 40.0% | 64,599 | 64,535 |
| 30% | 30.1% | 48,449 | 48,661 |
| 20% | 20.0% | 32,299 | 32,346 |
| 10% | 10.1% | 16,150 | 16,310 |
| Active Idle | 0 | 0 | |