SPECpower_ssj2008
Host 'WIN-42W0OIE8X3P' Performance Report
Copyright © 2007-2011 Standard Performance Evaluation Corporation
| Hitachi, Ltd. BS320 Server Blade C51P5 | ssj_ops@100% = 934,313 ssj_ops@100% per JVM = 155,719 |
||||
| Test Sponsor: | Hitachi, Ltd. | SPEC License #: | 35 | Test Method: | Multi Node |
| Tested By: | Hitachi, Ltd. | Test Location: | Hadano, Kanagawa, Japan | Test Date: | Feb 8, 2011 |
| Hardware Availability: | Feb-2011 | Software Availability: | Jun-2010 | Publication: | Feb 23, 2011 |
| System Source: | Single Supplier | System Designation: | Server | Power Provisioning: | Line-powered |
| Target Load | Actual Load | ssj_ops | |
|---|---|---|---|
| Target | Actual | ||
| Calibration 1 | 941,993 | ||
| Calibration 2 | 935,810 | ||
| Calibration 3 | 936,215 | ||
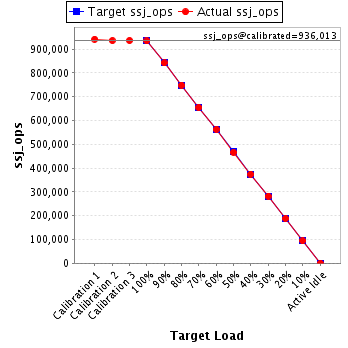
| ssj_ops@calibrated=936,013 | |||
| 100% | 99.8% | 936,013 | 934,313 |
| 90% | 90.0% | 842,411 | 842,031 |
| 80% | 80.0% | 748,810 | 748,969 |
| 70% | 70.0% | 655,209 | 654,897 |
| 60% | 60.2% | 561,608 | 563,370 |
| 50% | 49.9% | 468,006 | 466,614 |
| 40% | 40.0% | 374,405 | 374,448 |
| 30% | 30.1% | 280,804 | 282,085 |
| 20% | 20.1% | 187,203 | 187,954 |
| 10% | 10.1% | 93,601 | 94,246 |
| Active Idle | 0 | 0 | |
| Set Identifier: | sut |
| Set Description: | System Under Test |
| # of Identical Nodes: | 10 |
| Comment: | None |
| Hardware | |
|---|---|
| Hardware Vendor: | Hitachi, Ltd. |
| Model: | BS320 Server Blade C51P5 |
| Form Factor: | Blade |
| CPU Name: | Intel Xeon X5675 |
| CPU Characteristics: | Six Core, 3.06GHz, 12MB L3 Cache |
| CPU Frequency (MHz): | 3067 |
| CPU(s) Enabled: | 12 cores, 2 chips, 6 cores/chip |
| Hardware Threads: | 24 (2 / core) |
| CPU(s) Orderable: | 1,2 chips |
| Primary Cache: | 32 KB I + 32 KB D on chip per core |
| Secondary Cache: | 256 KB I+D on chip per core |
| Tertiary Cache: | 12 MB I+D on chip per chip |
| Other Cache: | None |
| Memory Amount (GB): | 24 |
| # and size of DIMM: | 6 x 4096 MB |
| Memory Details: | 4GB 2Rx4 PC3L-10600R ECC CL9 ; slots Memory0,1,2,3,4, and 5 populated |
| Power Supply Quantity and Rating (W): | None |
| Power Supply Details: | Shared |
| Disk Drive: | 1 x 32GB SSD SATA (Hitachi P/N: GG-UH9N32DN1EX) |
| Disk Controller: | Integrated SAS controller |
| # and type of Network Interface Cards (NICs) Installed: | 2 x Intel 82575EB Gigabit Network Connection (onboard) |
| NICs Enabled in Firmware / OS / Connected: | 2/1/1 |
| Network Speed (Mbit): | 1000 |
| Keyboard: | None |
| Mouse: | None |
| Monitor: | None |
| Optical Drives: | No |
| Other Hardware: | None |
| Software | |
|---|---|
| Power Management: | Enabled (Power saver) |
| Operating System (OS): | Microsoft Windows Server 2008 R2 Enterprise |
| OS Version: | R2 |
| Filesystem: | NTFS |
| JVM Vendor: | IBM Corporation |
| JVM Version: | IBM J9 VM (build 2.4, JRE 1.6.0 IBM J9 2.4 Windows Server 2008 amd64-64 jvmwa6460sr7-20100219_54049)(JIT enabled, AOT enabled) |
| JVM Command-line Options: | -Xaggressive -Xcompressedrefs -Xgcpolicy:gencon -Xmn1500 -Xms1875m -Xmx1875m -XlockReservation -Xnoloa -XtlhPrefetch -Xlp |
| JVM Affinity: | start /affinity [F,F0,F00,F000,F0000,F00000] |
| JVM Instances: | 6 |
| JVM Initial Heap (MB): | 1875 |
| JVM Maximum Heap (MB): | 1875 |
| JVM Address Bits: | 64 |
| Boot Firmware Version: | G15 |
| Management Firmware Version: | 01-51 |
| Workload Version: | SSJ 1.2.6 |
| Director Location: | Controller |
| Other Software: | IBM WebSphere Application Server V7.0 for Windows on x86-64 bit |
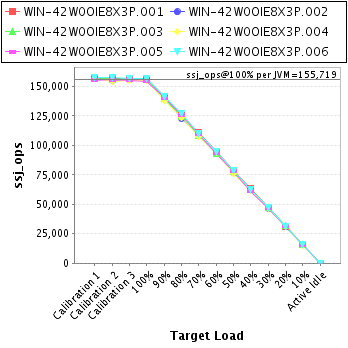
| JVM Instance | ssj_ops@100% |
|---|---|
| WIN-42W0OIE8X3P.001 | 157,015 |
| WIN-42W0OIE8X3P.002 | 155,664 |
| WIN-42W0OIE8X3P.003 | 155,791 |
| WIN-42W0OIE8X3P.004 | 154,915 |
| WIN-42W0OIE8X3P.005 | 154,455 |
| WIN-42W0OIE8X3P.006 | 156,474 |
| ssj_ops@100% | 934,313 |
| ssj_ops@100% per JVM | 155,719 |
| Target Load | Actual Load | ssj_ops | |
|---|---|---|---|
| Target | Actual | ||
| Calibration 1 | 157,483 | ||
| Calibration 2 | 157,189 | ||
| Calibration 3 | 157,045 | ||
| ssj_ops@calibrated=157,117 | |||
| 100% | 99.9% | 157,117 | 157,015 |
| 90% | 90.3% | 141,405 | 141,847 |
| 80% | 79.6% | 125,694 | 125,121 |
| 70% | 70.4% | 109,982 | 110,558 |
| 60% | 60.2% | 94,270 | 94,624 |
| 50% | 49.9% | 78,559 | 78,375 |
| 40% | 40.2% | 62,847 | 63,117 |
| 30% | 30.3% | 47,135 | 47,550 |
| 20% | 19.9% | 31,423 | 31,298 |
| 10% | 10.2% | 15,712 | 16,008 |
| Active Idle | 0 | 0 | |

| Target Load | Actual Load | ssj_ops | |
|---|---|---|---|
| Target | Actual | ||
| Calibration 1 | 157,300 | ||
| Calibration 2 | 155,266 | ||
| Calibration 3 | 156,009 | ||
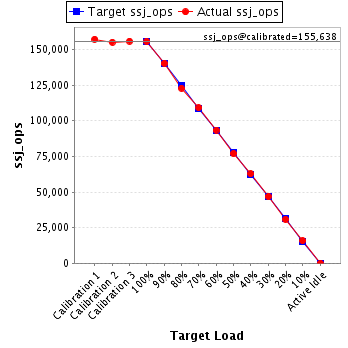
| ssj_ops@calibrated=155,638 | |||
| 100% | 100.0% | 155,638 | 155,664 |
| 90% | 90.2% | 140,074 | 140,339 |
| 80% | 79.0% | 124,510 | 122,944 |
| 70% | 70.2% | 108,946 | 109,192 |
| 60% | 60.1% | 93,383 | 93,518 |
| 50% | 49.5% | 77,819 | 76,965 |
| 40% | 40.4% | 62,255 | 62,801 |
| 30% | 30.1% | 46,691 | 46,871 |
| 20% | 19.8% | 31,128 | 30,859 |
| 10% | 10.1% | 15,564 | 15,794 |
| Active Idle | 0 | 0 | |
| Target Load | Actual Load | ssj_ops | |
|---|---|---|---|
| Target | Actual | ||
| Calibration 1 | 157,593 | ||
| Calibration 2 | 155,667 | ||
| Calibration 3 | 156,655 | ||
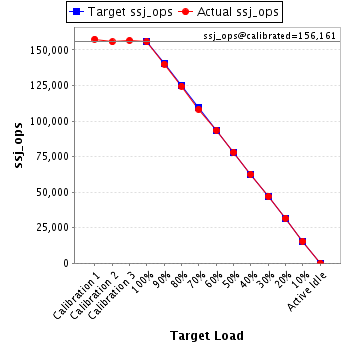
| ssj_ops@calibrated=156,161 | |||
| 100% | 99.8% | 156,161 | 155,791 |
| 90% | 89.7% | 140,545 | 140,067 |
| 80% | 79.8% | 124,929 | 124,563 |
| 70% | 69.3% | 109,313 | 108,244 |
| 60% | 59.9% | 93,697 | 93,478 |
| 50% | 50.0% | 78,081 | 78,139 |
| 40% | 40.0% | 62,465 | 62,476 |
| 30% | 30.1% | 46,848 | 47,075 |
| 20% | 20.3% | 31,232 | 31,704 |
| 10% | 9.9% | 15,616 | 15,520 |
| Active Idle | 0 | 0 | |
| Target Load | Actual Load | ssj_ops | |
|---|---|---|---|
| Target | Actual | ||
| Calibration 1 | 156,612 | ||
| Calibration 2 | 154,664 | ||
| Calibration 3 | 154,764 | ||
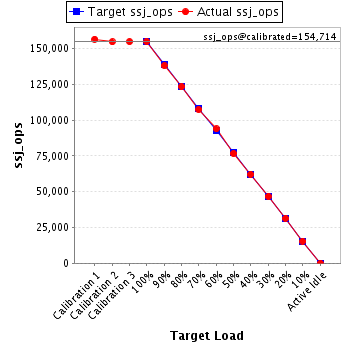
| ssj_ops@calibrated=154,714 | |||
| 100% | 100.1% | 154,714 | 154,915 |
| 90% | 89.2% | 139,243 | 138,063 |
| 80% | 79.8% | 123,771 | 123,385 |
| 70% | 69.4% | 108,300 | 107,420 |
| 60% | 60.7% | 92,828 | 93,889 |
| 50% | 49.5% | 77,357 | 76,585 |
| 40% | 40.2% | 61,886 | 62,145 |
| 30% | 30.2% | 46,414 | 46,726 |
| 20% | 20.3% | 30,943 | 31,483 |
| 10% | 10.0% | 15,471 | 15,452 |
| Active Idle | 0 | 0 | |
| Target Load | Actual Load | ssj_ops | |
|---|---|---|---|
| Target | Actual | ||
| Calibration 1 | 155,108 | ||
| Calibration 2 | 155,641 | ||
| Calibration 3 | 155,252 | ||
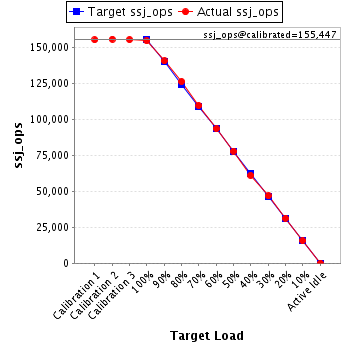
| ssj_ops@calibrated=155,447 | |||
| 100% | 99.4% | 155,447 | 154,455 |
| 90% | 90.4% | 139,902 | 140,494 |
| 80% | 81.2% | 124,357 | 126,158 |
| 70% | 70.5% | 108,813 | 109,529 |
| 60% | 60.1% | 93,268 | 93,414 |
| 50% | 50.1% | 77,723 | 77,937 |
| 40% | 39.3% | 62,179 | 61,054 |
| 30% | 30.1% | 46,634 | 46,758 |
| 20% | 20.1% | 31,089 | 31,313 |
| 10% | 10.1% | 15,545 | 15,647 |
| Active Idle | 0 | 0 | |
| Target Load | Actual Load | ssj_ops | |
|---|---|---|---|
| Target | Actual | ||
| Calibration 1 | 157,898 | ||
| Calibration 2 | 157,382 | ||
| Calibration 3 | 156,490 | ||
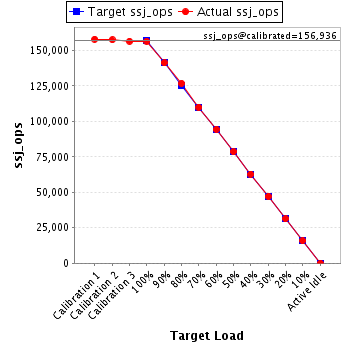
| ssj_ops@calibrated=156,936 | |||
| 100% | 99.7% | 156,936 | 156,474 |
| 90% | 90.0% | 141,242 | 141,221 |
| 80% | 80.8% | 125,549 | 126,797 |
| 70% | 70.1% | 109,855 | 109,954 |
| 60% | 60.2% | 94,162 | 94,446 |
| 50% | 50.1% | 78,468 | 78,612 |
| 40% | 40.1% | 62,774 | 62,855 |
| 30% | 30.0% | 47,081 | 47,105 |
| 20% | 19.9% | 31,387 | 31,295 |
| 10% | 10.1% | 15,694 | 15,824 |
| Active Idle | 0 | 0 | |