SPECpower_ssj2008
Host 'WIN-2T4FNUP38BQ' Performance Report
Copyright © 2007-2011 Standard Performance Evaluation Corporation
| Hitachi, Ltd. BS320 Server Blade C51P5 | ssj_ops@100% = 929,845 ssj_ops@100% per JVM = 154,974 |
||||
| Test Sponsor: | Hitachi, Ltd. | SPEC License #: | 35 | Test Method: | Multi Node |
| Tested By: | Hitachi, Ltd. | Test Location: | Hadano, Kanagawa, Japan | Test Date: | Feb 8, 2011 |
| Hardware Availability: | Feb-2011 | Software Availability: | Jun-2010 | Publication: | Feb 23, 2011 |
| System Source: | Single Supplier | System Designation: | Server | Power Provisioning: | Line-powered |
| Target Load | Actual Load | ssj_ops | |
|---|---|---|---|
| Target | Actual | ||
| Calibration 1 | 936,690 | ||
| Calibration 2 | 936,030 | ||
| Calibration 3 | 933,147 | ||
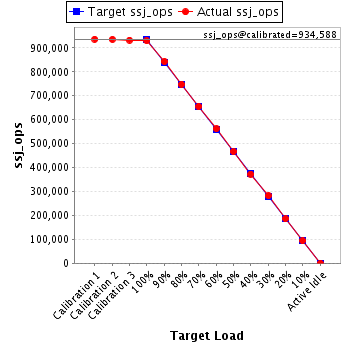
| ssj_ops@calibrated=934,588 | |||
| 100% | 99.5% | 934,588 | 929,845 |
| 90% | 90.3% | 841,130 | 843,603 |
| 80% | 80.1% | 747,671 | 748,155 |
| 70% | 70.2% | 654,212 | 655,614 |
| 60% | 60.2% | 560,753 | 562,503 |
| 50% | 50.0% | 467,294 | 467,363 |
| 40% | 39.9% | 373,835 | 372,955 |
| 30% | 30.2% | 280,377 | 282,399 |
| 20% | 19.8% | 186,918 | 185,386 |
| 10% | 10.1% | 93,459 | 94,169 |
| Active Idle | 0 | 0 | |
| Set Identifier: | sut |
| Set Description: | System Under Test |
| # of Identical Nodes: | 10 |
| Comment: | None |
| Hardware | |
|---|---|
| Hardware Vendor: | Hitachi, Ltd. |
| Model: | BS320 Server Blade C51P5 |
| Form Factor: | Blade |
| CPU Name: | Intel Xeon X5675 |
| CPU Characteristics: | Six Core, 3.06GHz, 12MB L3 Cache |
| CPU Frequency (MHz): | 3067 |
| CPU(s) Enabled: | 12 cores, 2 chips, 6 cores/chip |
| Hardware Threads: | 24 (2 / core) |
| CPU(s) Orderable: | 1,2 chips |
| Primary Cache: | 32 KB I + 32 KB D on chip per core |
| Secondary Cache: | 256 KB I+D on chip per core |
| Tertiary Cache: | 12 MB I+D on chip per chip |
| Other Cache: | None |
| Memory Amount (GB): | 24 |
| # and size of DIMM: | 6 x 4096 MB |
| Memory Details: | 4GB 2Rx4 PC3L-10600R ECC CL9 ; slots Memory0,1,2,3,4, and 5 populated |
| Power Supply Quantity and Rating (W): | None |
| Power Supply Details: | Shared |
| Disk Drive: | 1 x 32GB SSD SATA (Hitachi P/N: GG-UH9N32DN1EX) |
| Disk Controller: | Integrated SAS controller |
| # and type of Network Interface Cards (NICs) Installed: | 2 x Intel 82575EB Gigabit Network Connection (onboard) |
| NICs Enabled in Firmware / OS / Connected: | 2/1/1 |
| Network Speed (Mbit): | 1000 |
| Keyboard: | None |
| Mouse: | None |
| Monitor: | None |
| Optical Drives: | No |
| Other Hardware: | None |
| Software | |
|---|---|
| Power Management: | Enabled (Power saver) |
| Operating System (OS): | Microsoft Windows Server 2008 R2 Enterprise |
| OS Version: | R2 |
| Filesystem: | NTFS |
| JVM Vendor: | IBM Corporation |
| JVM Version: | IBM J9 VM (build 2.4, JRE 1.6.0 IBM J9 2.4 Windows Server 2008 amd64-64 jvmwa6460sr7-20100219_54049)(JIT enabled, AOT enabled) |
| JVM Command-line Options: | -Xaggressive -Xcompressedrefs -Xgcpolicy:gencon -Xmn1500 -Xms1875m -Xmx1875m -XlockReservation -Xnoloa -XtlhPrefetch -Xlp |
| JVM Affinity: | start /affinity [F,F0,F00,F000,F0000,F00000] |
| JVM Instances: | 6 |
| JVM Initial Heap (MB): | 1875 |
| JVM Maximum Heap (MB): | 1875 |
| JVM Address Bits: | 64 |
| Boot Firmware Version: | G15 |
| Management Firmware Version: | 01-51 |
| Workload Version: | SSJ 1.2.6 |
| Director Location: | Controller |
| Other Software: | IBM WebSphere Application Server V7.0 for Windows on x86-64 bit |
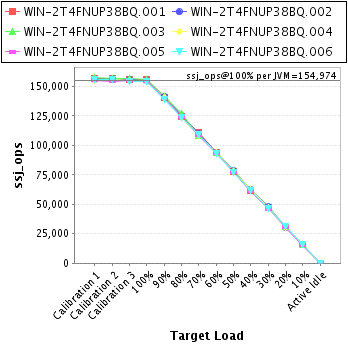
| JVM Instance | ssj_ops@100% |
|---|---|
| WIN-2T4FNUP38BQ.001 | 155,931 |
| WIN-2T4FNUP38BQ.002 | 154,732 |
| WIN-2T4FNUP38BQ.003 | 156,071 |
| WIN-2T4FNUP38BQ.004 | 154,246 |
| WIN-2T4FNUP38BQ.005 | 155,016 |
| WIN-2T4FNUP38BQ.006 | 153,848 |
| ssj_ops@100% | 929,845 |
| ssj_ops@100% per JVM | 154,974 |
| Target Load | Actual Load | ssj_ops | |
|---|---|---|---|
| Target | Actual | ||
| Calibration 1 | 156,969 | ||
| Calibration 2 | 157,067 | ||
| Calibration 3 | 155,980 | ||
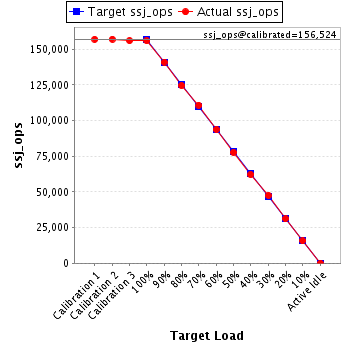
| ssj_ops@calibrated=156,524 | |||
| 100% | 99.6% | 156,524 | 155,931 |
| 90% | 90.1% | 140,871 | 141,027 |
| 80% | 79.5% | 125,219 | 124,465 |
| 70% | 70.8% | 109,566 | 110,855 |
| 60% | 59.9% | 93,914 | 93,820 |
| 50% | 49.7% | 78,262 | 77,773 |
| 40% | 39.7% | 62,609 | 62,107 |
| 30% | 30.4% | 46,957 | 47,589 |
| 20% | 19.9% | 31,305 | 31,107 |
| 10% | 10.0% | 15,652 | 15,729 |
| Active Idle | 0 | 0 | |
| Target Load | Actual Load | ssj_ops | |
|---|---|---|---|
| Target | Actual | ||
| Calibration 1 | 155,938 | ||
| Calibration 2 | 156,518 | ||
| Calibration 3 | 156,092 | ||
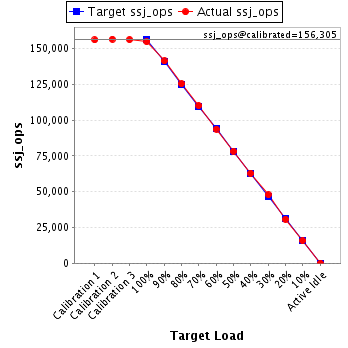
| ssj_ops@calibrated=156,305 | |||
| 100% | 99.0% | 156,305 | 154,732 |
| 90% | 90.4% | 140,675 | 141,272 |
| 80% | 80.2% | 125,044 | 125,333 |
| 70% | 70.4% | 109,414 | 110,087 |
| 60% | 60.0% | 93,783 | 93,752 |
| 50% | 50.1% | 78,153 | 78,319 |
| 40% | 40.2% | 62,522 | 62,879 |
| 30% | 30.6% | 46,892 | 47,829 |
| 20% | 19.7% | 31,261 | 30,748 |
| 10% | 10.1% | 15,631 | 15,791 |
| Active Idle | 0 | 0 | |
| Target Load | Actual Load | ssj_ops | |
|---|---|---|---|
| Target | Actual | ||
| Calibration 1 | 157,896 | ||
| Calibration 2 | 156,990 | ||
| Calibration 3 | 156,475 | ||
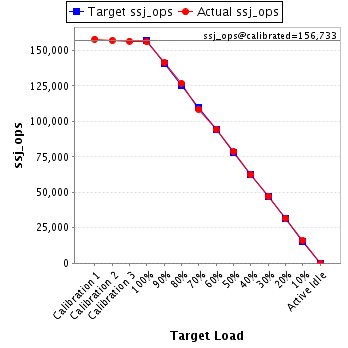
| ssj_ops@calibrated=156,733 | |||
| 100% | 99.6% | 156,733 | 156,071 |
| 90% | 90.2% | 141,060 | 141,385 |
| 80% | 80.9% | 125,386 | 126,849 |
| 70% | 69.2% | 109,713 | 108,521 |
| 60% | 60.2% | 94,040 | 94,410 |
| 50% | 50.2% | 78,366 | 78,668 |
| 40% | 39.7% | 62,693 | 62,238 |
| 30% | 30.1% | 47,020 | 47,229 |
| 20% | 20.2% | 31,347 | 31,608 |
| 10% | 10.3% | 15,673 | 16,104 |
| Active Idle | 0 | 0 | |
| Target Load | Actual Load | ssj_ops | |
|---|---|---|---|
| Target | Actual | ||
| Calibration 1 | 155,108 | ||
| Calibration 2 | 155,558 | ||
| Calibration 3 | 154,980 | ||
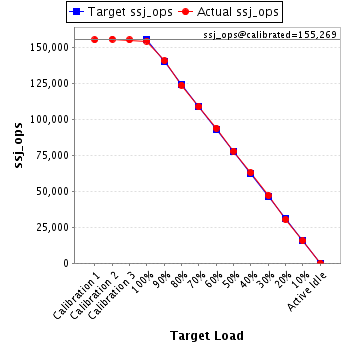
| ssj_ops@calibrated=155,269 | |||
| 100% | 99.3% | 155,269 | 154,246 |
| 90% | 90.5% | 139,742 | 140,594 |
| 80% | 79.6% | 124,215 | 123,543 |
| 70% | 70.0% | 108,688 | 108,691 |
| 60% | 60.4% | 93,161 | 93,848 |
| 50% | 50.2% | 77,634 | 77,908 |
| 40% | 40.5% | 62,108 | 62,823 |
| 30% | 30.3% | 46,581 | 46,998 |
| 20% | 19.5% | 31,054 | 30,354 |
| 10% | 10.1% | 15,527 | 15,611 |
| Active Idle | 0 | 0 | |
| Target Load | Actual Load | ssj_ops | |
|---|---|---|---|
| Target | Actual | ||
| Calibration 1 | 155,141 | ||
| Calibration 2 | 154,313 | ||
| Calibration 3 | 155,284 | ||
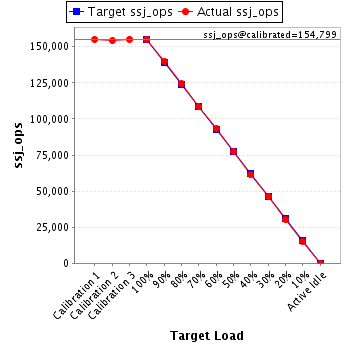
| ssj_ops@calibrated=154,799 | |||
| 100% | 100.1% | 154,799 | 155,016 |
| 90% | 90.5% | 139,319 | 140,026 |
| 80% | 80.3% | 123,839 | 124,258 |
| 70% | 70.1% | 108,359 | 108,570 |
| 60% | 60.3% | 92,879 | 93,398 |
| 50% | 50.1% | 77,399 | 77,622 |
| 40% | 39.6% | 61,920 | 61,266 |
| 30% | 29.9% | 46,440 | 46,335 |
| 20% | 19.7% | 30,960 | 30,485 |
| 10% | 9.9% | 15,480 | 15,393 |
| Active Idle | 0 | 0 | |
| Target Load | Actual Load | ssj_ops | |
|---|---|---|---|
| Target | Actual | ||
| Calibration 1 | 155,638 | ||
| Calibration 2 | 155,584 | ||
| Calibration 3 | 154,335 | ||
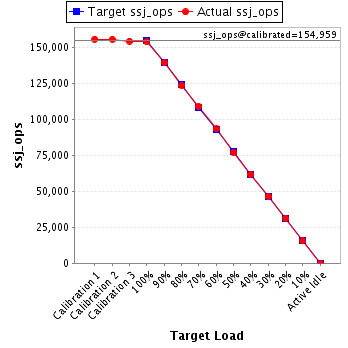
| ssj_ops@calibrated=154,959 | |||
| 100% | 99.3% | 154,959 | 153,848 |
| 90% | 89.9% | 139,463 | 139,299 |
| 80% | 79.8% | 123,967 | 123,707 |
| 70% | 70.3% | 108,471 | 108,890 |
| 60% | 60.2% | 92,976 | 93,274 |
| 50% | 49.7% | 77,480 | 77,073 |
| 40% | 39.8% | 61,984 | 61,642 |
| 30% | 30.0% | 46,488 | 46,417 |
| 20% | 20.1% | 30,992 | 31,084 |
| 10% | 10.0% | 15,496 | 15,543 |
| Active Idle | 0 | 0 | |